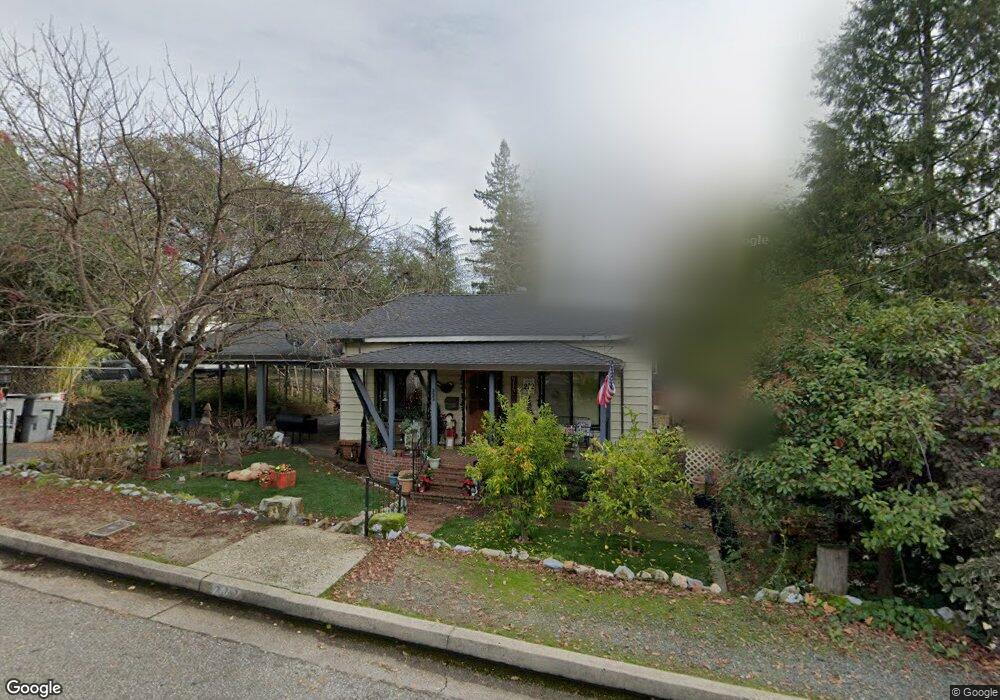
222 Foresthill Ave Auburn, CA 95603
Estimated Value: $406,000 - $572,000
3
Beds
1
Bath
1,400
Sq Ft
$353/Sq Ft
Est. Value
About This Home
This home is located at 222 Foresthill Ave, Auburn, CA 95603 and is currently estimated at $494,425, approximately $353 per square foot. 222 Foresthill Ave is a home located in Placer County with nearby schools including Skyridge Elementary School, Placer High School, and Alta Vista Community Charter.
Ownership History
Date
Name
Owned For
Owner Type
Purchase Details
Closed on
Aug 12, 2019
Sold by
Sorensen Eric and Sorensen Mary
Bought by
Sorensen Eric R and Sorensen Mary
Current Estimated Value
Home Financials for this Owner
Home Financials are based on the most recent Mortgage that was taken out on this home.
Original Mortgage
$300,000
Outstanding Balance
$262,745
Interest Rate
3.7%
Mortgage Type
New Conventional
Estimated Equity
$231,680
Purchase Details
Closed on
Apr 12, 2018
Sold by
Ridolfi Helen M
Bought by
Sorensen Eric and Sorensen Mary
Home Financials for this Owner
Home Financials are based on the most recent Mortgage that was taken out on this home.
Original Mortgage
$260,000
Interest Rate
4.43%
Mortgage Type
New Conventional
Purchase Details
Closed on
Dec 10, 1997
Sold by
Ridolfi Americo E and Ridolfi Helen M
Bought by
Ridolfi Americo E and Ridolfi Helen M
Create a Home Valuation Report for This Property
The Home Valuation Report is an in-depth analysis detailing your home's value as well as a comparison with similar homes in the area
Home Values in the Area
Average Home Value in this Area
Purchase History
| Date | Buyer | Sale Price | Title Company |
|---|---|---|---|
| Sorensen Eric R | -- | Old Republic Title Company | |
| Sorensen Eric | $280,000 | Old Republic Title Co | |
| Ridolfi Americo E | -- | -- |
Source: Public Records
Mortgage History
| Date | Status | Borrower | Loan Amount |
|---|---|---|---|
| Open | Sorensen Eric R | $300,000 | |
| Closed | Sorensen Eric | $260,000 |
Source: Public Records
Tax History Compared to Growth
Tax History
| Year | Tax Paid | Tax Assessment Tax Assessment Total Assessment is a certain percentage of the fair market value that is determined by local assessors to be the total taxable value of land and additions on the property. | Land | Improvement |
|---|---|---|---|---|
| 2025 | $4,252 | $318,586 | $102,402 | $216,184 |
| 2023 | $4,252 | $306,218 | $98,427 | $207,791 |
| 2022 | $4,201 | $300,215 | $96,498 | $203,717 |
| 2021 | $4,084 | $294,329 | $94,606 | $199,723 |
| 2020 | $4,062 | $291,312 | $93,636 | $197,676 |
| 2019 | $4,004 | $285,600 | $91,800 | $193,800 |
| 2018 | $1,312 | $33,157 | $7,312 | $25,845 |
| 2017 | $1,268 | $32,508 | $7,169 | $25,339 |
| 2016 | $1,225 | $31,872 | $7,029 | $24,843 |
| 2015 | $1,183 | $31,394 | $6,924 | $24,470 |
| 2014 | $1,073 | $30,780 | $6,789 | $23,991 |
Source: Public Records
Map
Nearby Homes
- 140 Oak St
- 381 Foresthill Ave
- 681 Foresthill Ave
- 440 Foresthill Ave
- 486 Foresthill Ave
- 438 Olive Orchard Dr
- 101 Lincoln Way
- 173 Center St
- 300 Cherry Ave
- 13005 Lincoln Way Unit F
- 13017 Lincoln Way Unit 88
- 143 Hillmont Ave
- 146 E Placer St
- 13061 Lincoln Way Unit B
- 13067 Lincoln Way Unit D
- 258 Swenson Ct
- 55 Neils
- 0 Atwood Rd Unit 225057955
- 266 Swenson Ct
- 34-35 Grass Valley Hwy
- 216 Foresthill Ave
- 210 Foresthill Ave
- 238 Foresthill Ave
- 225 Foresthill Ave
- 231 Foresthill Ave
- 235 Foresthill Ave
- 232 Foresthill Ave Unit B
- 236 Foresthill Ave Unit B
- 236 Foresthill Ave Unit A
- 234 Foresthill Ave Unit B
- 234 Foresthill Ave Unit A
- 232 Foresthill Ave Unit A
- 230 Foresthill Ave Unit B
- 230 Foresthill Ave Unit A
- 295 Grace St
- 171 Orr St
- 242 Foresthill Ave
- 206 Foresthill Ave
- 16110 Foresthill Ave
- 241 Foresthill Ave