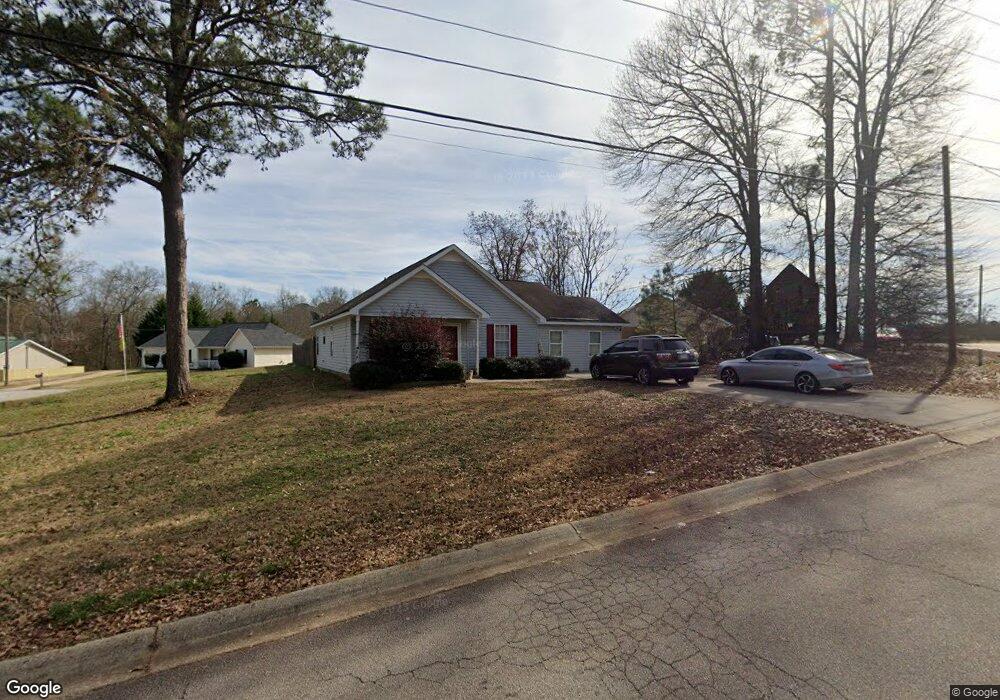
222 Kings Ct Jackson, GA 30233
Estimated Value: $225,404 - $249,000
3
Beds
2
Baths
1,208
Sq Ft
$196/Sq Ft
Est. Value
About This Home
This home is located at 222 Kings Ct, Jackson, GA 30233 and is currently estimated at $237,101, approximately $196 per square foot. 222 Kings Ct is a home located in Butts County with nearby schools including Jackson High School.
Ownership History
Date
Name
Owned For
Owner Type
Purchase Details
Closed on
Dec 10, 2021
Sold by
Foster Damien
Bought by
Foster Jill N
Current Estimated Value
Purchase Details
Closed on
Jul 13, 2017
Sold by
Higgins Bobby
Bought by
Foster Jill and Foster Damien
Home Financials for this Owner
Home Financials are based on the most recent Mortgage that was taken out on this home.
Original Mortgage
$58,000
Interest Rate
3.91%
Mortgage Type
New Conventional
Purchase Details
Closed on
Jun 18, 2014
Sold by
Hill Frank
Bought by
Higgins Bobby D and Higgins Darlene
Purchase Details
Closed on
Dec 14, 2011
Sold by
Brown Harold
Bought by
Hill Frank
Purchase Details
Closed on
Sep 19, 2011
Sold by
Secretary Of Housing
Bought by
Hill Frank
Purchase Details
Closed on
Jun 7, 2011
Sold by
Wells Fargo Bank Na
Bought by
Secretary Of Housing
Create a Home Valuation Report for This Property
The Home Valuation Report is an in-depth analysis detailing your home's value as well as a comparison with similar homes in the area
Home Values in the Area
Average Home Value in this Area
Purchase History
| Date | Buyer | Sale Price | Title Company |
|---|---|---|---|
| Foster Jill N | -- | -- | |
| Foster Jill | $78,000 | -- | |
| Higgins Bobby D | $40,000 | -- | |
| Hill Frank | -- | -- | |
| Hill Frank | $35,217 | -- | |
| Secretary Of Housing | $91,168 | -- | |
| Wells Fargo Bank Na | $91,168 | -- |
Source: Public Records
Mortgage History
| Date | Status | Borrower | Loan Amount |
|---|---|---|---|
| Previous Owner | Foster Jill | $58,000 |
Source: Public Records
Tax History
| Year | Tax Paid | Tax Assessment Tax Assessment Total Assessment is a certain percentage of the fair market value that is determined by local assessors to be the total taxable value of land and additions on the property. | Land | Improvement |
|---|---|---|---|---|
| 2025 | $2,194 | $95,621 | $11,968 | $83,653 |
| 2024 | $2,194 | $95,621 | $11,968 | $83,653 |
| 2023 | $2,308 | $77,739 | $11,968 | $65,771 |
| 2022 | $1,550 | $57,120 | $8,800 | $48,320 |
| 2021 | $1,459 | $52,233 | $8,800 | $43,433 |
| 2020 | $1,411 | $48,782 | $8,800 | $39,982 |
| 2019 | $1,268 | $45,484 | $8,800 | $36,684 |
| 2018 | $949 | $36,941 | $8,800 | $28,141 |
| 2017 | $198 | $33,422 | $6,400 | $27,022 |
| 2016 | $1,062 | $33,422 | $6,400 | $27,022 |
| 2015 | $532 | $29,250 | $4,800 | $24,450 |
| 2014 | $869 | $27,687 | $4,800 | $22,887 |
Source: Public Records
Map
Nearby Homes
- 266 Regal Rd
- 771 Regal Rd
- 514 Covington St
- 243 Glenn St
- 526 Cotton Dr
- 321 Kirts Ridge
- 630 N Mulberry St
- 196 Charlie Sheppard Rd
- 630 N North Mulberry St
- 347 Ww Carr Ave
- 415 White Pine Dr
- 0 Highway 36 E Unit 183636
- 0 Highway 36 E Unit 25704971
- 0 E Highway 36 Unit 10693968
- 0 Highway 36 E Unit 10714337
- 0 E Hwy 36 Unit 10611807
- 0 E Highway 36 Unit 7728846
- 124 Harper St
- 1375 Highway 42 S
- 1262 E Highway 16
Your Personal Tour Guide
Ask me questions while you tour the home.