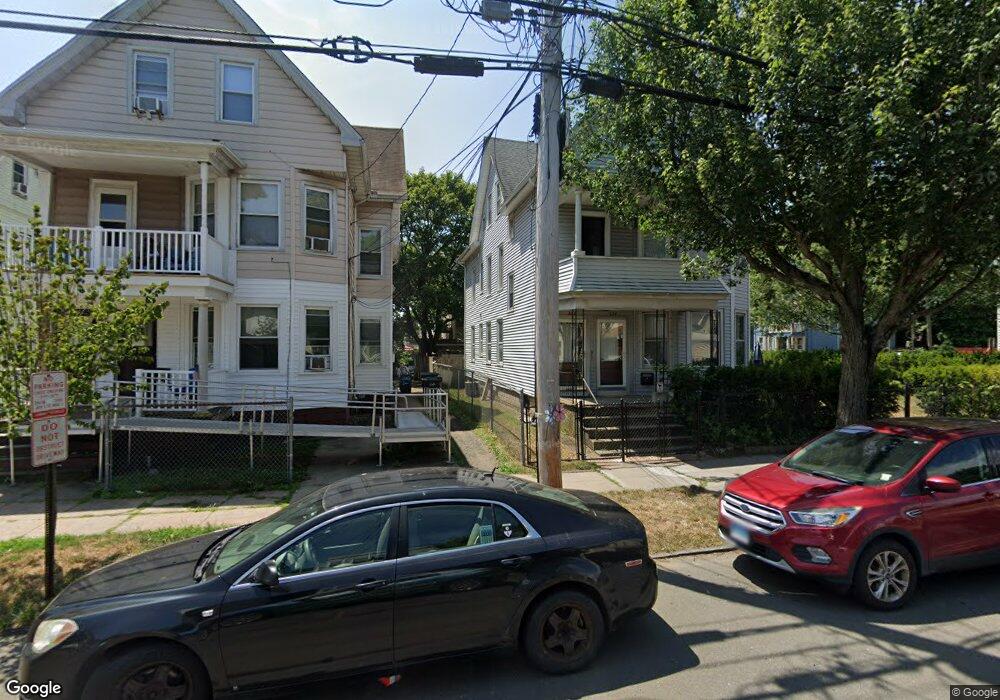
222 Lombard St New Haven, CT 06513
Fair Haven NeighborhoodEstimated Value: $362,845 - $558,000
6
Beds
4
Baths
3,278
Sq Ft
$135/Sq Ft
Est. Value
About This Home
This home is located at 222 Lombard St, New Haven, CT 06513 and is currently estimated at $443,711, approximately $135 per square foot. 222 Lombard St is a home located in New Haven County with nearby schools including Clinton Avenue School, Elm City College Preparatory School, and St Francis & St Rose Of Lima School.
Ownership History
Date
Name
Owned For
Owner Type
Purchase Details
Closed on
Apr 12, 1999
Sold by
Peniston Nancy L
Bought by
Segui Ramon
Current Estimated Value
Home Financials for this Owner
Home Financials are based on the most recent Mortgage that was taken out on this home.
Original Mortgage
$114,300
Interest Rate
6.83%
Create a Home Valuation Report for This Property
The Home Valuation Report is an in-depth analysis detailing your home's value as well as a comparison with similar homes in the area
Home Values in the Area
Average Home Value in this Area
Purchase History
| Date | Buyer | Sale Price | Title Company |
|---|---|---|---|
| Segui Ramon | $115,000 | -- |
Source: Public Records
Mortgage History
| Date | Status | Borrower | Loan Amount |
|---|---|---|---|
| Open | Segui Ramon | $191,000 | |
| Closed | Segui Ramon | $114,300 | |
| Closed | Segui Ramon | $6,200 |
Source: Public Records
Tax History Compared to Growth
Tax History
| Year | Tax Paid | Tax Assessment Tax Assessment Total Assessment is a certain percentage of the fair market value that is determined by local assessors to be the total taxable value of land and additions on the property. | Land | Improvement |
|---|---|---|---|---|
| 2025 | $8,448 | $214,410 | $48,160 | $166,250 |
| 2024 | $8,255 | $214,410 | $48,160 | $166,250 |
| 2023 | $7,976 | $214,410 | $48,160 | $166,250 |
| 2022 | $8,523 | $214,410 | $48,160 | $166,250 |
| 2021 | $6,106 | $139,160 | $33,950 | $105,210 |
| 2020 | $6,106 | $139,160 | $33,950 | $105,210 |
| 2019 | $5,981 | $139,160 | $33,950 | $105,210 |
| 2018 | $5,981 | $139,160 | $33,950 | $105,210 |
| 2017 | $5,383 | $139,160 | $33,950 | $105,210 |
| 2016 | $4,799 | $115,500 | $29,260 | $86,240 |
| 2015 | $4,799 | $115,500 | $29,260 | $86,240 |
| 2014 | $4,799 | $115,500 | $29,260 | $86,240 |
Source: Public Records
Map
Nearby Homes