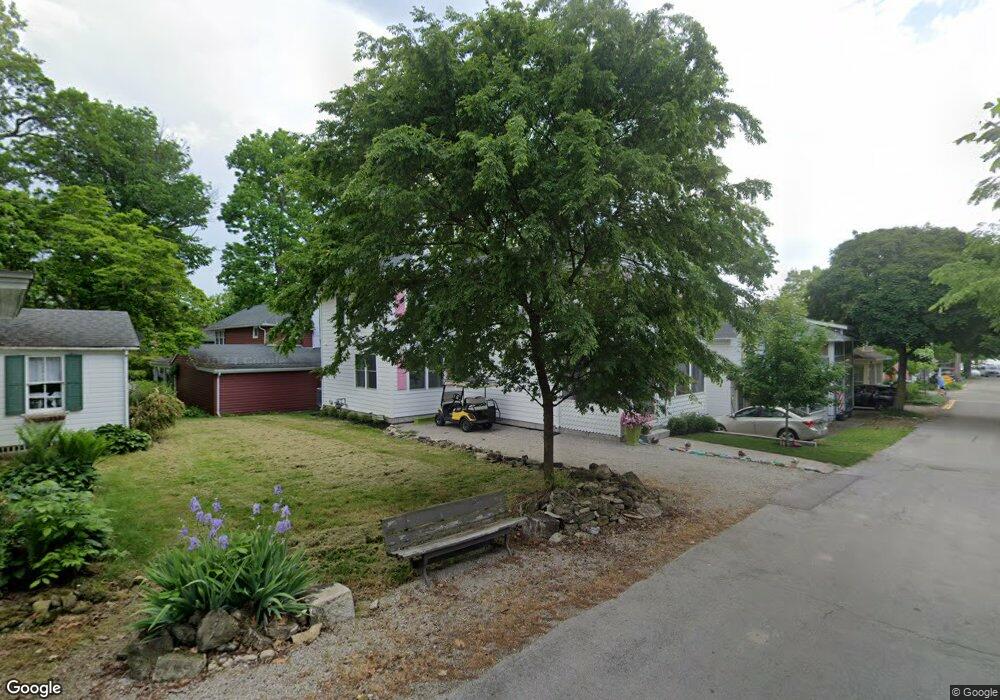
222 Lynn Ave Lakeside Marblehead, OH 43440
Estimated Value: $623,000 - $981,000
4
Beds
2
Baths
1,682
Sq Ft
$461/Sq Ft
Est. Value
About This Home
This home is located at 222 Lynn Ave, Lakeside Marblehead, OH 43440 and is currently estimated at $774,880, approximately $460 per square foot. 222 Lynn Ave is a home located in Ottawa County with nearby schools including Danbury Middle School and Danbury High School.
Ownership History
Date
Name
Owned For
Owner Type
Purchase Details
Closed on
Jan 23, 2025
Sold by
Olenik Sarah J
Bought by
Sarah J Olenik Revocable Living Trust
Current Estimated Value
Purchase Details
Closed on
May 15, 2002
Sold by
Litton Lester
Bought by
Olenik David W and Olenik Sarah J
Home Financials for this Owner
Home Financials are based on the most recent Mortgage that was taken out on this home.
Original Mortgage
$105,000
Interest Rate
7.16%
Mortgage Type
Balloon
Create a Home Valuation Report for This Property
The Home Valuation Report is an in-depth analysis detailing your home's value as well as a comparison with similar homes in the area
Home Values in the Area
Average Home Value in this Area
Purchase History
| Date | Buyer | Sale Price | Title Company |
|---|---|---|---|
| Sarah J Olenik Revocable Living Trust | -- | None Listed On Document | |
| Sarah J Olenik Revocable Living Trust | -- | None Listed On Document | |
| Olenik David W | $150,000 | -- |
Source: Public Records
Mortgage History
| Date | Status | Borrower | Loan Amount |
|---|---|---|---|
| Previous Owner | Olenik David W | $105,000 |
Source: Public Records
Tax History Compared to Growth
Tax History
| Year | Tax Paid | Tax Assessment Tax Assessment Total Assessment is a certain percentage of the fair market value that is determined by local assessors to be the total taxable value of land and additions on the property. | Land | Improvement |
|---|---|---|---|---|
| 2024 | $9,156 | $268,632 | $89,054 | $179,578 |
| 2023 | $9,156 | $177,149 | $80,962 | $96,187 |
| 2022 | $6,116 | $177,149 | $80,962 | $96,187 |
| 2021 | $3,652 | $105,460 | $80,960 | $24,500 |
| 2020 | $3,098 | $84,680 | $62,280 | $22,400 |
| 2019 | $2,867 | $84,680 | $62,280 | $22,400 |
| 2018 | $2,863 | $84,680 | $62,280 | $22,400 |
| 2017 | $2,611 | $76,430 | $57,920 | $18,510 |
| 2016 | $2,584 | $76,430 | $57,920 | $18,510 |
| 2015 | $2,594 | $76,430 | $57,920 | $18,510 |
| 2014 | $1,403 | $80,790 | $62,280 | $18,510 |
| 2013 | $2,604 | $80,790 | $62,280 | $18,510 |
Source: Public Records
Map
Nearby Homes