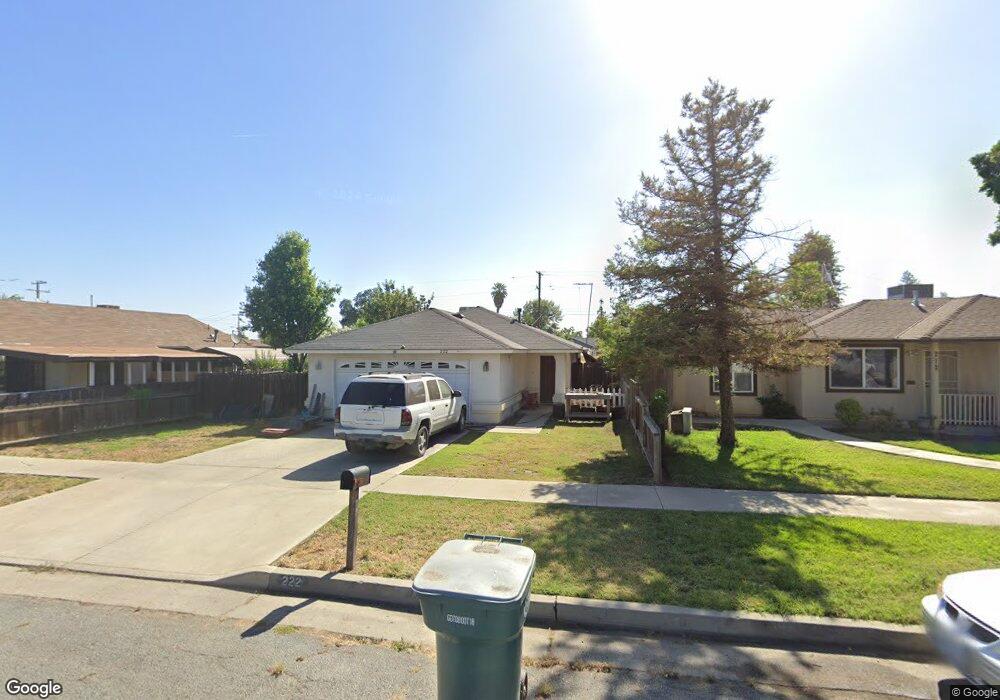
222 N D St Tulare, CA 93274
Estimated Value: $274,000 - $324,000
3
Beds
2
Baths
1,232
Sq Ft
$238/Sq Ft
Est. Value
About This Home
This home is located at 222 N D St, Tulare, CA 93274 and is currently estimated at $292,603, approximately $237 per square foot. 222 N D St is a home located in Tulare County with nearby schools including Maple Elementary School, Los Tules Middle School, and Tulare Western High School.
Ownership History
Date
Name
Owned For
Owner Type
Purchase Details
Closed on
May 18, 2021
Sold by
Endurance Holdings Llc
Bought by
Pepitareal Estate
Current Estimated Value
Home Financials for this Owner
Home Financials are based on the most recent Mortgage that was taken out on this home.
Original Mortgage
$3,060,000
Outstanding Balance
$2,746,195
Interest Rate
2.9%
Mortgage Type
New Conventional
Estimated Equity
-$2,453,592
Purchase Details
Closed on
Mar 27, 2018
Sold by
Mullinix Larry W and Mullinix Shirley J
Bought by
Endurance Holdings Llc
Purchase Details
Closed on
Oct 9, 1997
Sold by
Corvera Joel
Bought by
Mullinix Larry W and Mullinix Shirley J
Home Financials for this Owner
Home Financials are based on the most recent Mortgage that was taken out on this home.
Original Mortgage
$79,550
Interest Rate
7.26%
Mortgage Type
VA
Purchase Details
Closed on
Dec 5, 1996
Sold by
Corvera Joel
Bought by
Corvera Joel
Purchase Details
Closed on
Dec 2, 1993
Sold by
Bravo Alvina
Bought by
Gregory Donald D
Create a Home Valuation Report for This Property
The Home Valuation Report is an in-depth analysis detailing your home's value as well as a comparison with similar homes in the area
Home Values in the Area
Average Home Value in this Area
Purchase History
| Date | Buyer | Sale Price | Title Company |
|---|---|---|---|
| Pepitareal Estate | $5,100,000 | Chicago Title | |
| Endurance Holdings Llc | $137,423 | None Available | |
| Mullinix Larry W | $78,000 | -- | |
| Corvera Joel | -- | -- | |
| Corvera Joel | $9,090 | Old Republic Title Company | |
| Gregory Donald D | $10,000 | Chicago Title Company |
Source: Public Records
Mortgage History
| Date | Status | Borrower | Loan Amount |
|---|---|---|---|
| Open | Pepitareal Estate | $3,060,000 | |
| Previous Owner | Mullinix Larry W | $79,550 |
Source: Public Records
Tax History Compared to Growth
Tax History
| Year | Tax Paid | Tax Assessment Tax Assessment Total Assessment is a certain percentage of the fair market value that is determined by local assessors to be the total taxable value of land and additions on the property. | Land | Improvement |
|---|---|---|---|---|
| 2025 | $2,533 | $232,721 | $54,121 | $178,600 |
| 2024 | $2,533 | $228,159 | $53,060 | $175,099 |
| 2023 | $2,469 | $223,686 | $52,020 | $171,666 |
| 2022 | $2,396 | $147,428 | $32,166 | $115,262 |
| 2021 | $1,590 | $144,537 | $31,535 | $113,002 |
| 2020 | $1,617 | $143,055 | $31,212 | $111,843 |
| 2019 | $1,658 | $140,250 | $30,600 | $109,650 |
| 2018 | $1,215 | $109,463 | $23,854 | $85,609 |
| 2017 | $1,203 | $107,316 | $23,386 | $83,930 |
| 2016 | $1,148 | $105,211 | $22,927 | $82,284 |
| 2015 | $1,107 | $103,631 | $22,583 | $81,048 |
| 2014 | $1,107 | $101,601 | $22,141 | $79,460 |
Source: Public Records
Map
Nearby Homes
- 348 N F St
- 717 W Kern Ave
- 560 N F St
- 947 W Kern Ave
- 1112 W San Joaquin Ave
- 260 N Los Angeles St
- 724 W Sonora Ave
- 110 W Owens Ave
- 605 Catalina Cir
- 615 Catalina Cir
- 429 S Sacramento St
- 2045 Madalyn Ave
- 202 N L St
- 1969 Oak Falls Ct
- 1922 Oak Falls Ct Unit 5 Wo
- 1975 Oak Falls Ct Unit 8 Wo
- 1922 Oak Falls Ct
- 1969 Oak Falls Ct Unit 9 Wo
- 1900 Oak Falls Ct
- 1989 Oak Falls Ct Unit 7 Wo