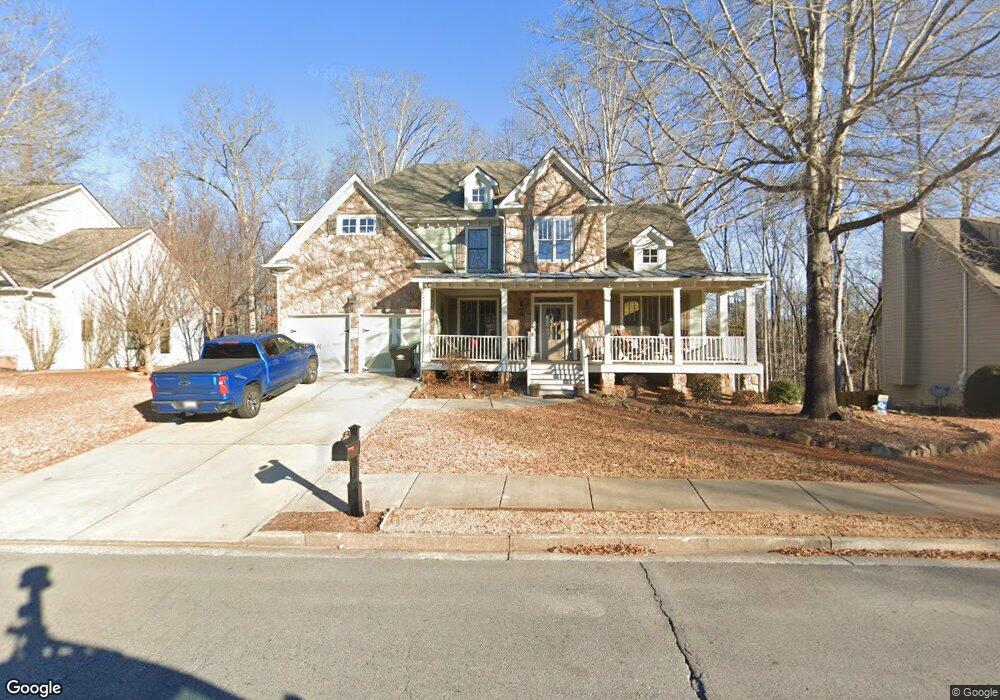
222 Pine Bluff Dr Unit 1 Dallas, GA 30157
Cedarcrest NeighborhoodEstimated Value: $465,236 - $518,000
4
Beds
3
Baths
2,717
Sq Ft
$181/Sq Ft
Est. Value
About This Home
This home is located at 222 Pine Bluff Dr Unit 1, Dallas, GA 30157 and is currently estimated at $491,559, approximately $180 per square foot. 222 Pine Bluff Dr Unit 1 is a home located in Paulding County with nearby schools including Roland W. Russom Elementary School, East Paulding Middle School, and North Paulding High School.
Ownership History
Date
Name
Owned For
Owner Type
Purchase Details
Closed on
Oct 28, 2016
Sold by
Frendt Martin J and Frendt Dawn W
Bought by
Johnson David B and Johnson Sarah R
Current Estimated Value
Home Financials for this Owner
Home Financials are based on the most recent Mortgage that was taken out on this home.
Original Mortgage
$283,765
Outstanding Balance
$228,387
Interest Rate
3.5%
Mortgage Type
FHA
Estimated Equity
$263,172
Purchase Details
Closed on
Aug 17, 2005
Sold by
Homes Of Cornerstone
Bought by
Frendt Martin J and Frendt Dawn
Home Financials for this Owner
Home Financials are based on the most recent Mortgage that was taken out on this home.
Original Mortgage
$232,291
Interest Rate
5.61%
Create a Home Valuation Report for This Property
The Home Valuation Report is an in-depth analysis detailing your home's value as well as a comparison with similar homes in the area
Home Values in the Area
Average Home Value in this Area
Purchase History
| Date | Buyer | Sale Price | Title Company |
|---|---|---|---|
| Johnson David B | $289,000 | -- | |
| Frendt Martin J | $332,300 | -- |
Source: Public Records
Mortgage History
| Date | Status | Borrower | Loan Amount |
|---|---|---|---|
| Open | Johnson David B | $283,765 | |
| Previous Owner | Frendt Martin J | $232,291 |
Source: Public Records
Tax History Compared to Growth
Tax History
| Year | Tax Paid | Tax Assessment Tax Assessment Total Assessment is a certain percentage of the fair market value that is determined by local assessors to be the total taxable value of land and additions on the property. | Land | Improvement |
|---|---|---|---|---|
| 2024 | $4,718 | $189,652 | $26,000 | $163,652 |
| 2023 | $4,670 | $179,116 | $26,000 | $153,116 |
| 2022 | $4,128 | $158,356 | $26,000 | $132,356 |
| 2021 | $3,800 | $130,760 | $26,000 | $104,760 |
| 2020 | $3,778 | $127,200 | $26,000 | $101,200 |
| 2019 | $3,708 | $123,080 | $26,000 | $97,080 |
| 2018 | $3,506 | $116,360 | $26,000 | $90,360 |
| 2017 | $3,335 | $109,160 | $26,000 | $83,160 |
| 2016 | $3,086 | $103,920 | $26,000 | $77,920 |
| 2015 | $2,986 | $98,880 | $27,600 | $71,280 |
| 2014 | $2,958 | $95,560 | $27,600 | $67,960 |
| 2013 | -- | $75,960 | $27,600 | $48,360 |
Source: Public Records
Map
Nearby Homes
- 20 Evergreen Way
- 36 Evergreen Way
- 00 Hiram Acworth Hwy
- 454 Pine Bluff Dr
- 11 Blue Spruce Trail
- 73 White Spruce Trail
- 334 Maple View Ct
- 75 Pine Creek Ct
- 200 Pine Trail
- The Adams Plan at Timberlands Station
- 66 Pine Creek Ct Unit 73
- 58 Pine Trail
- 288 Pine Way
- 320 Mill Creek Hollow
- 21 Mill Creek Hollow
- 84 Mill Creek Hollow
- 33 Mill Creek Hollow
- 612 Homestead Dr
- 373 Homestead Dr
- 45 Homestead Dr
- 222 Pine Bluff Dr
- 240 Pine Bluff Dr
- 202 Pine Bluff Dr
- 225 Pine Bluff Dr
- 205 Pine Bluff Dr
- 205 Pine Bluff Dr
- 0 Pine Bluff Dr Unit 7509170
- 0 Pine Bluff Dr Unit 7105870
- 0 Pine Bluff Dr Unit 8269129
- 0 Pine Bluff Dr Unit 8202327
- 0 Pine Bluff Dr Unit 8158226
- 0 Pine Bluff Dr Unit 8522798
- 0 Pine Bluff Dr Unit 8355329
- 0 Pine Bluff Dr Unit 8071967
- 0 Pine Bluff Dr Unit 7540735
- 0 Pine Bluff Dr Unit 7530049
- 0 Pine Bluff Dr Unit 7446509
- 0 Pine Bluff Dr Unit 7313218
- 261 Pine Bluff Dr
- 256 Pine Bluff Dr