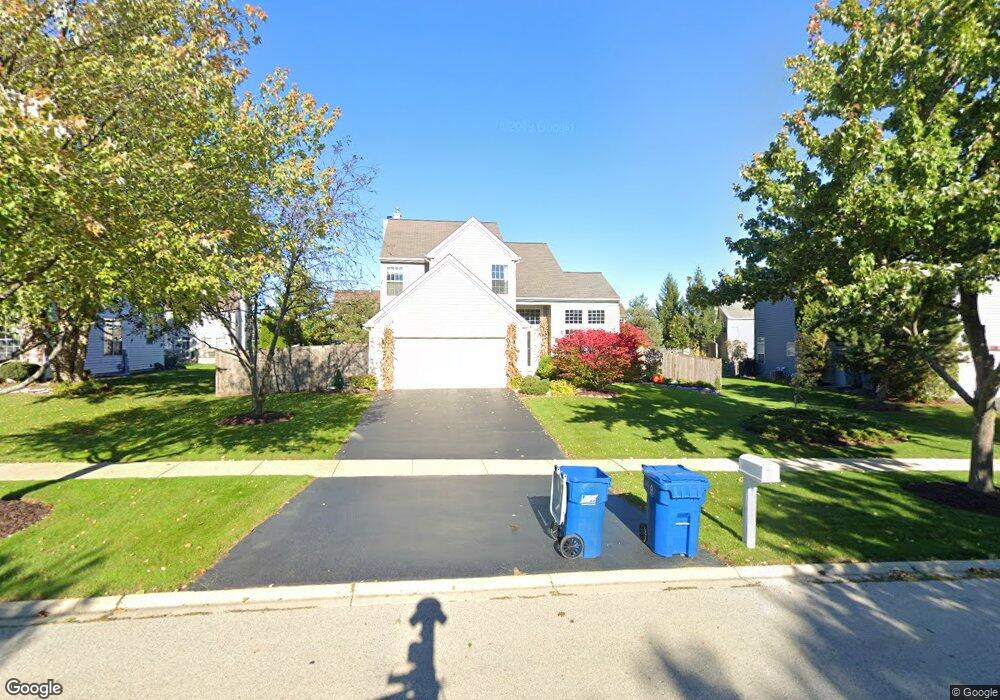
222 Remington Dr Bartlett, IL 60103
Estimated Value: $502,444 - $525,000
4
Beds
3
Baths
2,223
Sq Ft
$230/Sq Ft
Est. Value
About This Home
This home is located at 222 Remington Dr, Bartlett, IL 60103 and is currently estimated at $511,611, approximately $230 per square foot. 222 Remington Dr is a home located in Cook County with nearby schools including Nature Ridge Elementary School, Kenyon Woods Middle School, and South Elgin High School.
Ownership History
Date
Name
Owned For
Owner Type
Purchase Details
Closed on
Jun 26, 1998
Sold by
Montross Scott J and Montross Stacey E
Bought by
Zolecki Michael A and Zolecki Penelope J
Current Estimated Value
Home Financials for this Owner
Home Financials are based on the most recent Mortgage that was taken out on this home.
Original Mortgage
$133,000
Interest Rate
6.59%
Purchase Details
Closed on
Nov 10, 1997
Sold by
Lukkes Charles J and Lukkes Tanya L
Bought by
Montross Scott J and Montross Stacey E
Home Financials for this Owner
Home Financials are based on the most recent Mortgage that was taken out on this home.
Original Mortgage
$140,000
Interest Rate
7.38%
Purchase Details
Closed on
Oct 1, 1996
Sold by
2728 Holding Corp
Bought by
Lukkes Charles J and Lukkes Tanya L
Home Financials for this Owner
Home Financials are based on the most recent Mortgage that was taken out on this home.
Original Mortgage
$209,000
Interest Rate
8.23%
Create a Home Valuation Report for This Property
The Home Valuation Report is an in-depth analysis detailing your home's value as well as a comparison with similar homes in the area
Home Values in the Area
Average Home Value in this Area
Purchase History
| Date | Buyer | Sale Price | Title Company |
|---|---|---|---|
| Zolecki Michael A | $223,000 | -- | |
| Montross Scott J | $221,000 | -- | |
| Lukkes Charles J | $222,000 | -- |
Source: Public Records
Mortgage History
| Date | Status | Borrower | Loan Amount |
|---|---|---|---|
| Previous Owner | Zolecki Michael A | $133,000 | |
| Previous Owner | Montross Scott J | $140,000 | |
| Previous Owner | Lukkes Charles J | $209,000 |
Source: Public Records
Tax History Compared to Growth
Tax History
| Year | Tax Paid | Tax Assessment Tax Assessment Total Assessment is a certain percentage of the fair market value that is determined by local assessors to be the total taxable value of land and additions on the property. | Land | Improvement |
|---|---|---|---|---|
| 2024 | $9,466 | $36,000 | $9,138 | $26,862 |
| 2023 | $9,089 | $36,000 | $9,138 | $26,862 |
| 2022 | $9,089 | $36,000 | $9,138 | $26,862 |
| 2021 | $8,385 | $28,726 | $8,063 | $20,663 |
| 2020 | $8,431 | $28,726 | $8,063 | $20,663 |
| 2019 | $8,365 | $31,918 | $8,063 | $23,855 |
| 2018 | $7,775 | $28,211 | $6,988 | $21,223 |
| 2017 | $7,682 | $28,211 | $6,988 | $21,223 |
| 2016 | $7,762 | $28,211 | $6,988 | $21,223 |
| 2015 | $8,153 | $25,131 | $6,181 | $18,950 |
| 2014 | $8,064 | $25,131 | $6,181 | $18,950 |
| 2013 | $7,725 | $25,131 | $6,181 | $18,950 |
Source: Public Records
Map
Nearby Homes
- 227 Faircroft Rd Unit 1
- 1969 Osprey Ct Unit 223
- 151 Fountain Grass Cir Unit 26
- 240 Hearthstone Dr
- 180 Primrose Ln Unit 1
- 186 Sunflower Ln
- 184 Primrose Ln Unit 1
- 171 Silbury Dr
- 1057 Moraine Dr
- 1016 Moraine Dr
- 1079 Atterberg Rd
- 537 Rose Ln
- 1618 Thornbury Rd Unit 1224
- 200 Patrick Dr
- 629 Dogleg Ln
- 1318 Foxglove Dr
- 1314 Foxglove Dr
- 1316 Foxglove Dr
- 1458 Deer Pointe Dr
- 1390 Wild Tulip Cir
- 226 Remington Dr
- 218 Remington Dr
- 1963 Westridge Blvd
- 1955 Westridge Blvd
- 1967 Westridge Blvd
- 230 Remington Dr
- 1951 Westridge Blvd
- 221 Remington Dr Unit 5
- 217 Remington Dr Unit 5
- 1971 Westridge Blvd
- 1947 Westridge Blvd Unit 2
- 234 Remington Dr
- 213 Remington Dr Unit 5
- 210 Remington Dr Unit 5
- 1975 Westridge Blvd
- 229 Remington Dr
- 1943 Westridge Blvd
- 1958 Westridge Blvd
- 220 Edgewater Dr
- 1954 Westridge Blvd