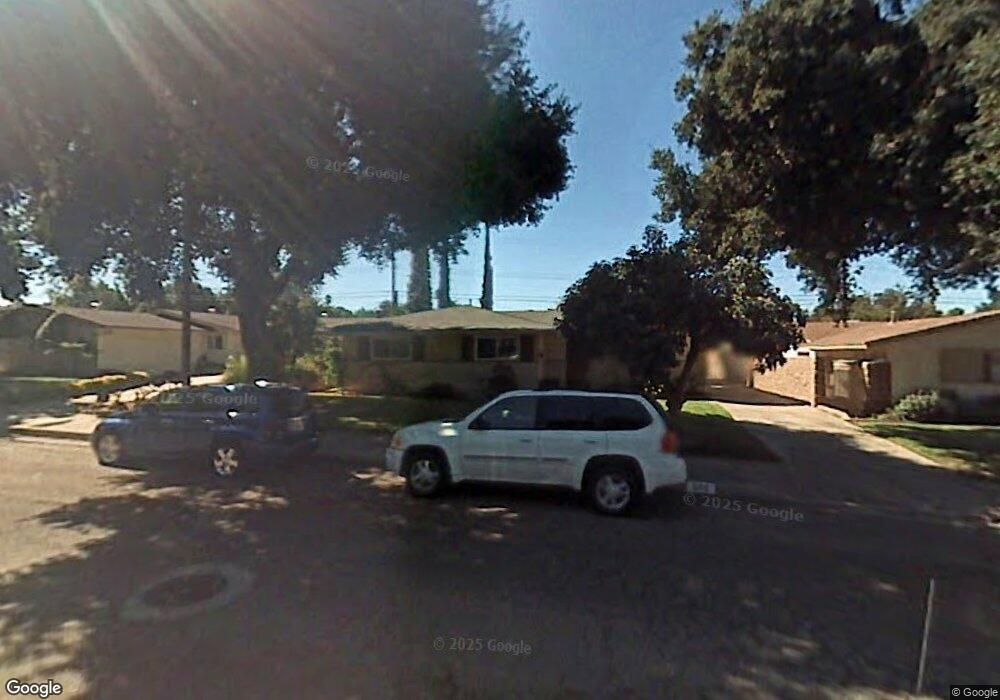
222 Roma St Redlands, CA 92373
South Redlands NeighborhoodEstimated Value: $544,975 - $629,000
3
Beds
2
Baths
1,431
Sq Ft
$418/Sq Ft
Est. Value
About This Home
This home is located at 222 Roma St, Redlands, CA 92373 and is currently estimated at $598,744, approximately $418 per square foot. 222 Roma St is a home located in San Bernardino County with nearby schools including McKinley Elementary School, Cope Middle School, and Redlands Senior High School.
Ownership History
Date
Name
Owned For
Owner Type
Purchase Details
Closed on
Aug 21, 1997
Sold by
Anda Suzanne T
Bought by
Anda Suzanne T and Suzanne T Anda Trust
Current Estimated Value
Purchase Details
Closed on
Mar 13, 1997
Sold by
Anda Suzanne T
Bought by
Anda Suzanne T
Home Financials for this Owner
Home Financials are based on the most recent Mortgage that was taken out on this home.
Original Mortgage
$60,500
Interest Rate
7.9%
Create a Home Valuation Report for This Property
The Home Valuation Report is an in-depth analysis detailing your home's value as well as a comparison with similar homes in the area
Home Values in the Area
Average Home Value in this Area
Purchase History
| Date | Buyer | Sale Price | Title Company |
|---|---|---|---|
| Anda Suzanne T | -- | -- | |
| Anda Suzanne T | -- | Orange Coast Title |
Source: Public Records
Mortgage History
| Date | Status | Borrower | Loan Amount |
|---|---|---|---|
| Closed | Anda Suzanne T | $60,500 |
Source: Public Records
Tax History Compared to Growth
Tax History
| Year | Tax Paid | Tax Assessment Tax Assessment Total Assessment is a certain percentage of the fair market value that is determined by local assessors to be the total taxable value of land and additions on the property. | Land | Improvement |
|---|---|---|---|---|
| 2025 | $634 | $58,221 | $12,109 | $46,112 |
| 2024 | $634 | $57,080 | $11,872 | $45,208 |
| 2023 | $632 | $55,961 | $11,639 | $44,322 |
| 2022 | $621 | $54,864 | $11,411 | $43,453 |
| 2021 | $630 | $53,788 | $11,187 | $42,601 |
| 2020 | $621 | $53,236 | $11,072 | $42,164 |
| 2019 | $603 | $52,192 | $10,855 | $41,337 |
| 2018 | $587 | $51,168 | $10,642 | $40,526 |
| 2017 | $581 | $50,164 | $10,433 | $39,731 |
| 2016 | $573 | $49,180 | $10,228 | $38,952 |
| 2015 | $568 | $48,441 | $10,074 | $38,367 |
| 2014 | $556 | $47,492 | $9,877 | $37,615 |
Source: Public Records
Map
Nearby Homes
- 133 S San Mateo St
- 975 Brookside Ave
- 628 W Fern Ave
- 521 Bond St
- 230 S Buena Vista St
- 1044 W Cypress Ave
- 1239 Fulbright Ave
- 1110 W Cypress Ave
- 9440 Hollie Dr
- 325 Lakeside Ave
- 1302 San Pablo Ave
- 162 Lakeside Ave
- 28 N Michigan St
- 305 W Olive Ave
- 636 Harding Dr
- 24 Grant St
- 24 N Buena Vista St
- 87 Tennessee St Unit C
- 527 Nottingham Dr
- 622 Esther Way