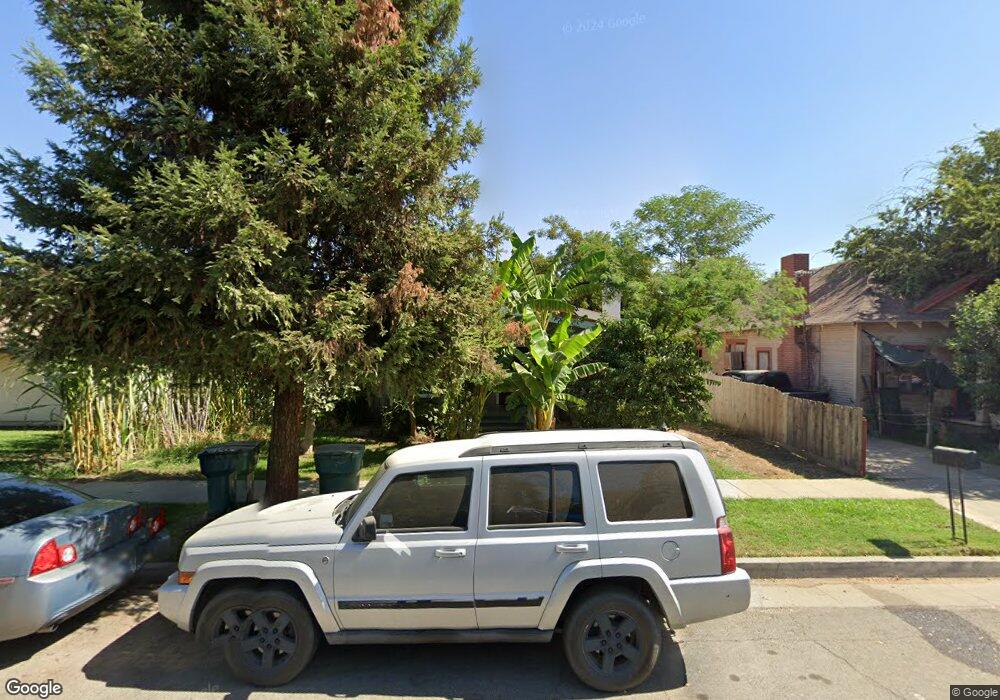
222 S F St Tulare, CA 93274
Estimated Value: $235,276 - $270,000
--
Bed
--
Bath
1,466
Sq Ft
$173/Sq Ft
Est. Value
About This Home
This home is located at 222 S F St, Tulare, CA 93274 and is currently estimated at $253,069, approximately $172 per square foot. 222 S F St is a home located in Tulare County with nearby schools including Wilson Elementary School, Cherry Avenue Middle School, and Tulare Union High School.
Ownership History
Date
Name
Owned For
Owner Type
Purchase Details
Closed on
Sep 5, 2019
Sold by
Iglesias Juan Alvarez
Bought by
Alvarez Iglesias Juan and Iglesias Lourdes Romero
Current Estimated Value
Purchase Details
Closed on
Oct 11, 1994
Sold by
Iglesias Lourdes
Bought by
Iglesias Juan Alvarez
Home Financials for this Owner
Home Financials are based on the most recent Mortgage that was taken out on this home.
Original Mortgage
$60,784
Interest Rate
9.1%
Mortgage Type
FHA
Create a Home Valuation Report for This Property
The Home Valuation Report is an in-depth analysis detailing your home's value as well as a comparison with similar homes in the area
Home Values in the Area
Average Home Value in this Area
Purchase History
| Date | Buyer | Sale Price | Title Company |
|---|---|---|---|
| Alvarez Iglesias Juan | -- | None Available | |
| Iglesias Juan Alvarez | -- | Fidelity National Title | |
| Iglesias Juan Alvarez | $62,000 | Fidelity National Title |
Source: Public Records
Mortgage History
| Date | Status | Borrower | Loan Amount |
|---|---|---|---|
| Previous Owner | Iglesias Juan Alvarez | $60,784 |
Source: Public Records
Tax History Compared to Growth
Tax History
| Year | Tax Paid | Tax Assessment Tax Assessment Total Assessment is a certain percentage of the fair market value that is determined by local assessors to be the total taxable value of land and additions on the property. | Land | Improvement |
|---|---|---|---|---|
| 2025 | $1,080 | $106,398 | $33,991 | $72,407 |
| 2024 | $1,080 | $104,313 | $33,325 | $70,988 |
| 2023 | $1,051 | $102,269 | $32,672 | $69,597 |
| 2022 | $1,019 | $100,265 | $32,032 | $68,233 |
| 2021 | $1,005 | $98,299 | $31,404 | $66,895 |
| 2020 | $1,021 | $97,291 | $31,082 | $66,209 |
| 2019 | $1,045 | $95,384 | $30,473 | $64,911 |
| 2018 | $1,026 | $93,513 | $29,875 | $63,638 |
| 2017 | $1,015 | $91,679 | $29,289 | $62,390 |
| 2016 | $969 | $89,882 | $28,715 | $61,167 |
| 2015 | $854 | $88,532 | $28,284 | $60,248 |
| 2014 | $854 | $80,000 | $20,000 | $60,000 |
Source: Public Records
Map
Nearby Homes