Estimated Value: $654,000 - $807,000
--
Bed
1
Bath
2,226
Sq Ft
$327/Sq Ft
Est. Value
About This Home
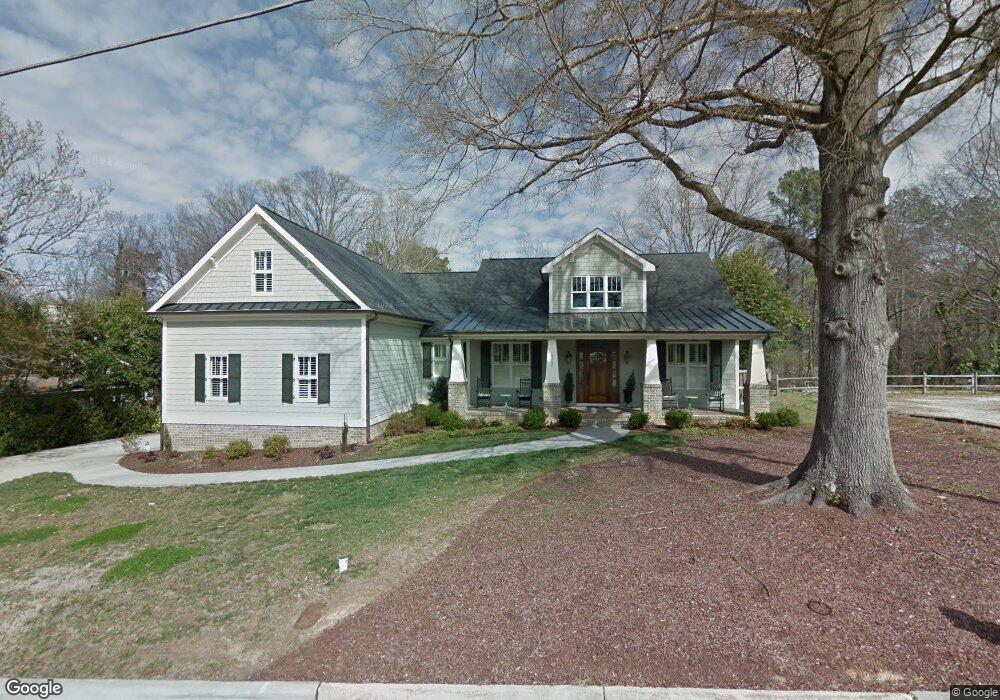
This home is located at 222 W Chatham St Unit 1, Apex, NC 27502 and is currently estimated at $728,688, approximately $327 per square foot. 222 W Chatham St Unit 1 is a home located in Wake County with nearby schools including Baucom Elementary School, Apex Middle, and Apex High School.
Ownership History
Date
Name
Owned For
Owner Type
Purchase Details
Closed on
May 22, 2014
Sold by
Rodgers John F and Rodgers Catherine
Bought by
Banning Paula H
Current Estimated Value
Home Financials for this Owner
Home Financials are based on the most recent Mortgage that was taken out on this home.
Original Mortgage
$408,000
Outstanding Balance
$316,970
Interest Rate
4.37%
Mortgage Type
New Conventional
Estimated Equity
$411,718
Purchase Details
Closed on
Dec 28, 1999
Sold by
Parker Alton Bernard and Parker Linda
Bought by
Foster Douglas L and Foster Betty P
Home Financials for this Owner
Home Financials are based on the most recent Mortgage that was taken out on this home.
Original Mortgage
$75,000
Interest Rate
6.75%
Create a Home Valuation Report for This Property
The Home Valuation Report is an in-depth analysis detailing your home's value as well as a comparison with similar homes in the area
Home Values in the Area
Average Home Value in this Area
Purchase History
| Date | Buyer | Sale Price | Title Company |
|---|---|---|---|
| Banning Paula H | $177,000 | None Available | |
| Foster Douglas L | $60,000 | -- |
Source: Public Records
Mortgage History
| Date | Status | Borrower | Loan Amount |
|---|---|---|---|
| Open | Banning Paula H | $408,000 | |
| Previous Owner | Foster Douglas L | $75,000 |
Source: Public Records
Tax History Compared to Growth
Tax History
| Year | Tax Paid | Tax Assessment Tax Assessment Total Assessment is a certain percentage of the fair market value that is determined by local assessors to be the total taxable value of land and additions on the property. | Land | Improvement |
|---|---|---|---|---|
| 2025 | $6,902 | $788,247 | $200,000 | $588,247 |
| 2024 | $6,748 | $788,247 | $200,000 | $588,247 |
| 2023 | $5,826 | $529,298 | $130,000 | $399,298 |
| 2022 | $5,469 | $529,298 | $130,000 | $399,298 |
| 2021 | $5,260 | $529,298 | $130,000 | $399,298 |
| 2020 | $5,018 | $526,078 | $130,000 | $396,078 |
| 2019 | $4,749 | $416,438 | $125,000 | $291,438 |
| 2018 | $4,473 | $416,438 | $125,000 | $291,438 |
| 2017 | $4,164 | $416,438 | $125,000 | $291,438 |
| 2016 | $4,103 | $416,438 | $125,000 | $291,438 |
| 2015 | $3,987 | $120,000 | $120,000 | $0 |
| 2014 | $1,162 | $120,000 | $120,000 | $0 |
Source: Public Records
Map
Nearby Homes
- 202 W Chatham St
- 506 W Chatham St
- 307 S Elm St
- 410 2nd St
- 406 S Salem St
- 309 Culvert St
- 311 Culvert St
- 105 Cunningham St
- 547 Grand Central Station
- 596 Grand Central Station
- 1434 Salem Creek Dr
- 1614 Brussels Dr
- 303 Knightsborough Way
- 635 Sawcut Ln
- 631 Sawcut Ln
- 633 Sawcut Ln
- 1115 Platform Dr
- 1111 Platform Dr
- 318 Glaston Ct
- 903 Norwood Ln
- 222 W Chatham St
- 218 W Chatham St
- 304 W Chatham St
- 223 W Chatham St
- 214 W Chatham St
- 219 W Chatham St
- 104 Jones St
- 306 W Chatham St
- 107 Jones St
- 301 Saunders St
- 210 W Chatham St
- 215 W Chatham St
- 309 W Chatham St
- 108 Jones St
- 305 Saunders St
- 307 Saunders St
- 211 W Chatham St
- 310 W Chatham St
- 311 W Chatham St
- 110 Jones St