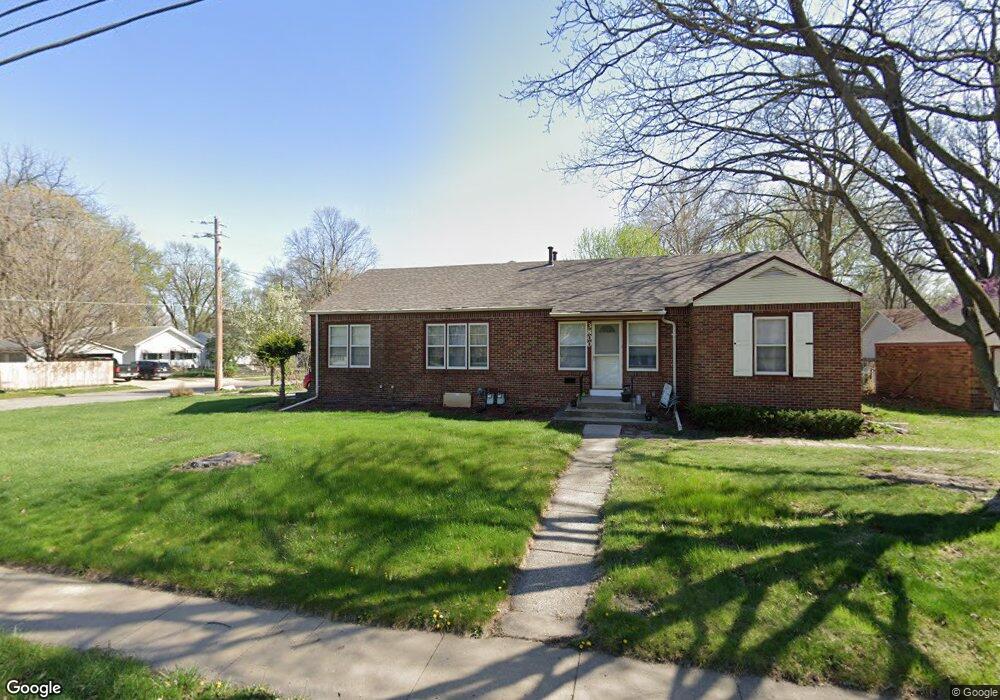
2220 38th St Des Moines, IA 50310
Beaverdale NeighborhoodEstimated Value: $216,000 - $274,556
3
Beds
2
Baths
1,564
Sq Ft
$154/Sq Ft
Est. Value
About This Home
This home is located at 2220 38th St, Des Moines, IA 50310 and is currently estimated at $241,139, approximately $154 per square foot. 2220 38th St is a home located in Polk County with nearby schools including Perkins Elementary School, Merrill Middle School, and Roosevelt High School.
Ownership History
Date
Name
Owned For
Owner Type
Purchase Details
Closed on
Sep 20, 2024
Sold by
Casey Thomas C
Bought by
Tlc Trust4
Current Estimated Value
Purchase Details
Closed on
Aug 30, 2024
Sold by
Erin Investments Llc
Bought by
Kcrb Properties Llc
Purchase Details
Closed on
Dec 29, 2006
Sold by
Spuzello Frederick D and Spuzello Mary T
Bought by
Erin Investments Llc
Purchase Details
Closed on
Aug 17, 1999
Sold by
Iowa State Bank
Bought by
Spuzello Fred D and Spuzello Mary T
Home Financials for this Owner
Home Financials are based on the most recent Mortgage that was taken out on this home.
Original Mortgage
$100,000
Interest Rate
7.7%
Mortgage Type
Seller Take Back
Purchase Details
Closed on
Apr 22, 1999
Sold by
Gore Andre A and Gore Teresa L
Bought by
Iowa State Bank
Create a Home Valuation Report for This Property
The Home Valuation Report is an in-depth analysis detailing your home's value as well as a comparison with similar homes in the area
Home Values in the Area
Average Home Value in this Area
Purchase History
| Date | Buyer | Sale Price | Title Company |
|---|---|---|---|
| Tlc Trust4 | -- | None Listed On Document | |
| Casey Lucille | -- | None Listed On Document | |
| Kcrb Properties Llc | $1,125,500 | None Listed On Document | |
| Kcrb Properties Llc | $1,125,500 | None Listed On Document | |
| Erin Investments Llc | $130,000 | None Listed On Document | |
| Spuzello Fred D | $114,500 | -- | |
| Iowa State Bank | $91,191 | -- |
Source: Public Records
Mortgage History
| Date | Status | Borrower | Loan Amount |
|---|---|---|---|
| Previous Owner | Spuzello Fred D | $100,000 |
Source: Public Records
Tax History Compared to Growth
Tax History
| Year | Tax Paid | Tax Assessment Tax Assessment Total Assessment is a certain percentage of the fair market value that is determined by local assessors to be the total taxable value of land and additions on the property. | Land | Improvement |
|---|---|---|---|---|
| 2025 | $4,378 | $243,700 | $62,100 | $181,600 |
| 2024 | $4,378 | $222,500 | $55,800 | $166,700 |
| 2023 | $4,346 | $222,500 | $55,800 | $166,700 |
| 2022 | $4,312 | $184,400 | $49,300 | $135,100 |
| 2021 | $4,238 | $184,400 | $49,300 | $135,100 |
| 2020 | $4,402 | $169,800 | $45,100 | $124,700 |
| 2019 | $4,152 | $169,800 | $45,100 | $124,700 |
| 2018 | $4,110 | $154,500 | $40,200 | $114,300 |
| 2017 | $3,718 | $154,500 | $40,200 | $114,300 |
| 2016 | $3,624 | $137,500 | $35,200 | $102,300 |
| 2015 | $3,624 | $137,500 | $35,200 | $102,300 |
| 2014 | $3,884 | $146,200 | $33,300 | $112,900 |
Source: Public Records
Map
Nearby Homes