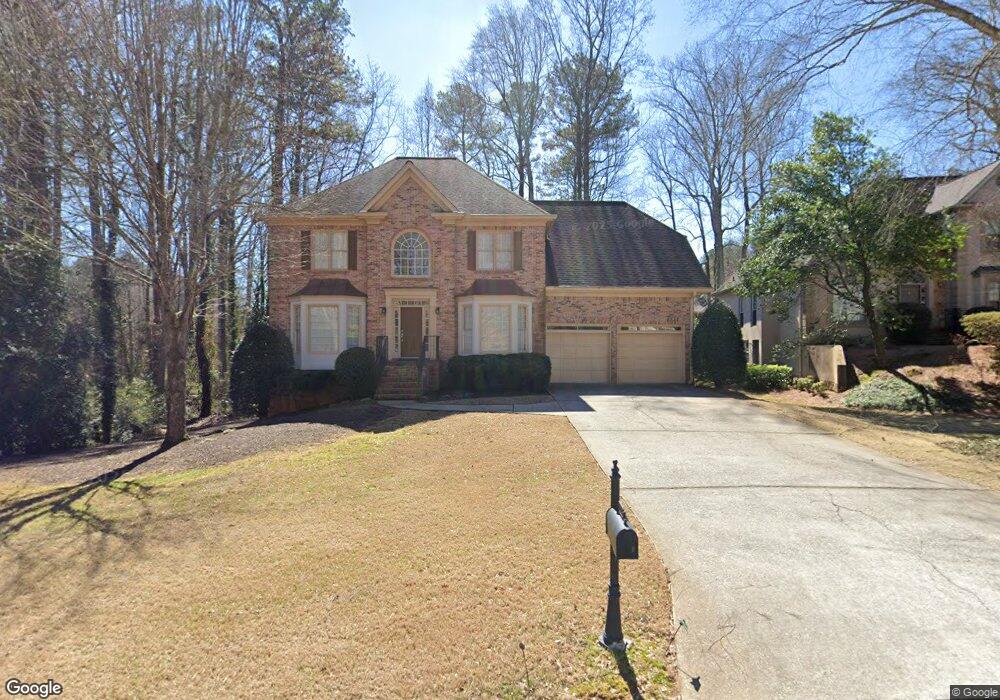
2220 Austin Lake Dr SE Unit 1 Smyrna, GA 30082
Estimated Value: $707,000 - $842,000
4
Beds
3
Baths
3,179
Sq Ft
$240/Sq Ft
Est. Value
About This Home
This home is located at 2220 Austin Lake Dr SE Unit 1, Smyrna, GA 30082 and is currently estimated at $763,872, approximately $240 per square foot. 2220 Austin Lake Dr SE Unit 1 is a home located in Cobb County with nearby schools including King Springs Elementary School, Griffin Middle School, and Campbell High School.
Ownership History
Date
Name
Owned For
Owner Type
Purchase Details
Closed on
Oct 24, 2001
Sold by
Brashear Robert M and Brashear Ruth A
Bought by
Gordon Carmen D
Current Estimated Value
Home Financials for this Owner
Home Financials are based on the most recent Mortgage that was taken out on this home.
Original Mortgage
$223,920
Outstanding Balance
$85,599
Interest Rate
6.57%
Mortgage Type
New Conventional
Estimated Equity
$678,273
Purchase Details
Closed on
Jan 25, 2001
Sold by
Love James R and Love Shirley A
Bought by
Brashear Robert M and Brashear Ruth A
Home Financials for this Owner
Home Financials are based on the most recent Mortgage that was taken out on this home.
Original Mortgage
$275,000
Interest Rate
7.44%
Mortgage Type
New Conventional
Purchase Details
Closed on
Dec 4, 1995
Sold by
Redden Prop Inc
Bought by
Love James R Shirley A
Create a Home Valuation Report for This Property
The Home Valuation Report is an in-depth analysis detailing your home's value as well as a comparison with similar homes in the area
Home Values in the Area
Average Home Value in this Area
Purchase History
| Date | Buyer | Sale Price | Title Company |
|---|---|---|---|
| Gordon Carmen D | $279,900 | -- | |
| Brashear Robert M | $275,000 | -- | |
| Love James R Shirley A | $249,900 | -- |
Source: Public Records
Mortgage History
| Date | Status | Borrower | Loan Amount |
|---|---|---|---|
| Open | Gordon Carmen D | $223,920 | |
| Previous Owner | Brashear Robert M | $275,000 | |
| Closed | Love James R Shirley A | $0 |
Source: Public Records
Tax History Compared to Growth
Tax History
| Year | Tax Paid | Tax Assessment Tax Assessment Total Assessment is a certain percentage of the fair market value that is determined by local assessors to be the total taxable value of land and additions on the property. | Land | Improvement |
|---|---|---|---|---|
| 2025 | $6,322 | $300,192 | $80,000 | $220,192 |
| 2024 | $6,322 | $300,192 | $80,000 | $220,192 |
| 2023 | $4,991 | $255,204 | $80,000 | $175,204 |
| 2022 | $4,205 | $185,144 | $36,000 | $149,144 |
| 2021 | $4,229 | $185,144 | $36,000 | $149,144 |
| 2020 | $4,229 | $185,144 | $36,000 | $149,144 |
| 2019 | $3,991 | $172,652 | $32,000 | $140,652 |
| 2018 | $3,788 | $161,980 | $32,000 | $129,980 |
| 2017 | $3,609 | $161,980 | $32,000 | $129,980 |
| 2016 | $3,153 | $137,860 | $32,000 | $105,860 |
| 2015 | $3,222 | $137,860 | $32,000 | $105,860 |
| 2014 | $3,250 | $137,860 | $0 | $0 |
Source: Public Records
Map
Nearby Homes
- 4222 Terrace Ct SE
- 3538 S Sherwood Rd SE Unit 5
- 1522 Grace Meadows Ln SE
- 3654 Lake Dr SE
- 550 Micayne Cir SE Unit 1
- 3568 Lake Dr SE
- 538 Micayne Cir SE Unit 3
- 3462 S Sherwood Rd SE
- 629 Dunton Cir SE
- 3844 Lake Dr SE
- 436 Concord Rd SE
- 3375 Emerson St SE
- 3933 N Cooper Lake Rd SE
- 3941 Lake Dr SE
- 1024 Magnolia Dr SE
- 3543 S Cobb Dr SE
- 3244 Hampton Ct SE
- 2218 Austin Lake Dr SE
- 2222 Austin Lake Dr SE Unit 1
- 4217 Terrace Ct SE Unit 1
- 4215 Terrace Ct SE Unit 1
- 2216 Austin Lake Dr SE
- 2219 Austin Lake Dr SE
- 4219 Terrace Ct SE Unit 1
- 2221 Austin Lake Dr SE
- 4213 Terrace Ct SE
- 4211 Terrace Ct SE Unit 1
- 0 Austin Lake Dr Unit 7186488
- 0 Austin Lake Dr
- 2217 Austin Lake Dr SE
- 2224 Austin Lake Dr SE
- 6204 Traymore Trace SE Unit 2
- 2214 Austin Lake Dr SE
- 4209 Terrace Ct SE
- 2223 Austin Lake Dr SE Unit 1
- 2215 Austin Lake Dr SE
- 6206 Traymore Trace SE