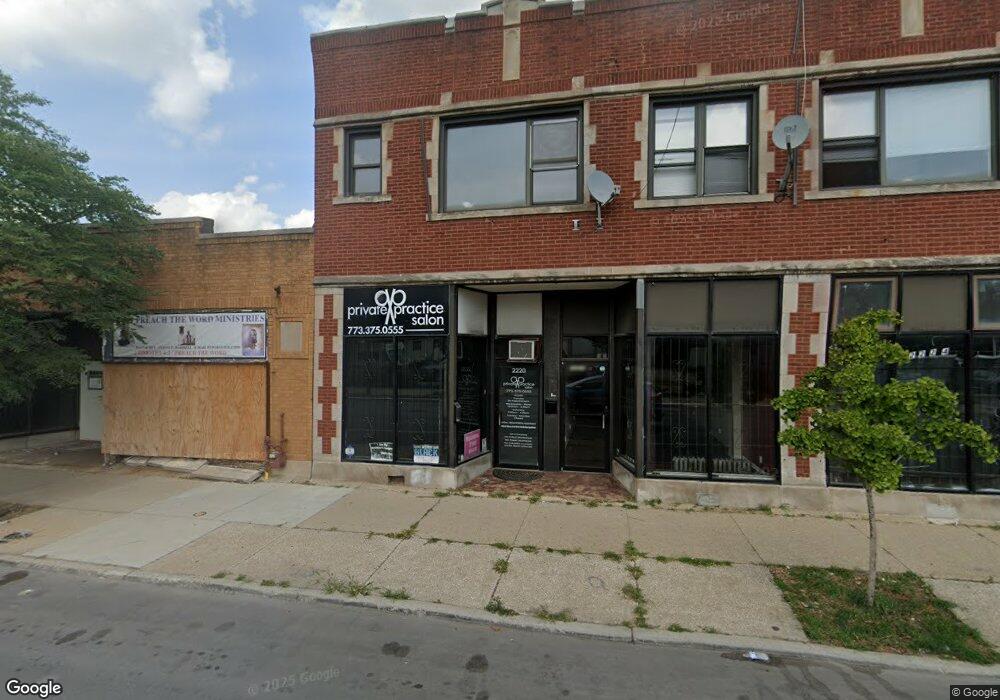
2220 E 75th St Chicago, IL 60649
South Shore NeighborhoodEstimated Value: $749,441
13
Beds
--
Bath
11,490
Sq Ft
$65/Sq Ft
Est. Value
About This Home
This home is located at 2220 E 75th St, Chicago, IL 60649 and is currently estimated at $749,441, approximately $65 per square foot. 2220 E 75th St is a home located in Cook County with nearby schools including Bouchet Elementary Math & Science Academy and St Philip Neri Elementary School.
Ownership History
Date
Name
Owned For
Owner Type
Purchase Details
Closed on
Sep 13, 2021
Sold by
Neder Capital Services Llc
Bought by
7450 S Luella Llc
Current Estimated Value
Home Financials for this Owner
Home Financials are based on the most recent Mortgage that was taken out on this home.
Original Mortgage
$461,250
Outstanding Balance
$99,761
Interest Rate
4%
Mortgage Type
Commercial
Estimated Equity
$649,680
Purchase Details
Closed on
May 7, 2020
Sold by
Equitybuild Inc
Bought by
Neder Capital Services Llc
Purchase Details
Closed on
May 12, 2017
Sold by
Revital Inc
Bought by
Ssph Portfolio 1 Llc
Home Financials for this Owner
Home Financials are based on the most recent Mortgage that was taken out on this home.
Original Mortgage
$4,100,000
Interest Rate
4.1%
Mortgage Type
Future Advance Clause Open End Mortgage
Purchase Details
Closed on
Jun 25, 2015
Sold by
Equitybuild Inc
Bought by
Revital Inc
Home Financials for this Owner
Home Financials are based on the most recent Mortgage that was taken out on this home.
Original Mortgage
$594,000
Interest Rate
3.86%
Mortgage Type
Commercial
Purchase Details
Closed on
May 6, 2015
Sold by
Luella Rentals Llc
Bought by
Equitybuild Inc
Home Financials for this Owner
Home Financials are based on the most recent Mortgage that was taken out on this home.
Original Mortgage
$594,000
Interest Rate
3.86%
Mortgage Type
Commercial
Purchase Details
Closed on
Jul 26, 2012
Sold by
Derech Llc
Bought by
Luella Rentals Llc
Home Financials for this Owner
Home Financials are based on the most recent Mortgage that was taken out on this home.
Original Mortgage
$226,120
Interest Rate
3.35%
Mortgage Type
Construction
Purchase Details
Closed on
Jun 30, 2005
Sold by
State Bank Of Countryside
Bought by
Derech Llc
Home Financials for this Owner
Home Financials are based on the most recent Mortgage that was taken out on this home.
Original Mortgage
$420,000
Interest Rate
5.87%
Mortgage Type
Commercial
Purchase Details
Closed on
May 12, 2003
Sold by
Seaway National Bank Of Chicago
Bought by
The State Bank Of Countryside and Trust #03-2484
Home Financials for this Owner
Home Financials are based on the most recent Mortgage that was taken out on this home.
Original Mortgage
$252,000
Interest Rate
6.25%
Mortgage Type
Commercial
Purchase Details
Closed on
Jul 1, 1996
Sold by
The Chicago Trust Company
Bought by
Seaway National Bank Of Chicago
Home Financials for this Owner
Home Financials are based on the most recent Mortgage that was taken out on this home.
Original Mortgage
$168,000
Interest Rate
8.07%
Mortgage Type
Commercial
Create a Home Valuation Report for This Property
The Home Valuation Report is an in-depth analysis detailing your home's value as well as a comparison with similar homes in the area
Home Values in the Area
Average Home Value in this Area
Purchase History
| Date | Buyer | Sale Price | Title Company |
|---|---|---|---|
| 7450 S Luella Llc | $615,000 | Chicago Title | |
| Neder Capital Services Llc | $278,000 | First American Title | |
| Ssph Portfolio 1 Llc | $610,000 | None Available | |
| Revital Inc | $544,000 | First American Title Ins Co | |
| Equitybuild Inc | $370,000 | None Available | |
| Luella Rentals Llc | $230,000 | None Available | |
| Derech Llc | $557,500 | Pntn | |
| The State Bank Of Countryside | $311,000 | Cti | |
| The State Bank Of Countryside | $311,000 | Cti | |
| Seaway National Bank Of Chicago | $210,000 | -- |
Source: Public Records
Mortgage History
| Date | Status | Borrower | Loan Amount |
|---|---|---|---|
| Open | 7450 S Luella Llc | $461,250 | |
| Previous Owner | Ssph Portfolio 1 Llc | $4,100,000 | |
| Previous Owner | Revital Inc | $594,000 | |
| Previous Owner | Luella Rentals Llc | $226,120 | |
| Previous Owner | Derech Llc | $420,000 | |
| Previous Owner | The State Bank Of Countryside | $252,000 | |
| Previous Owner | Seaway National Bank Of Chicago | $168,000 |
Source: Public Records
Tax History Compared to Growth
Tax History
| Year | Tax Paid | Tax Assessment Tax Assessment Total Assessment is a certain percentage of the fair market value that is determined by local assessors to be the total taxable value of land and additions on the property. | Land | Improvement |
|---|---|---|---|---|
| 2024 | $13,022 | $89,600 | $6,765 | $82,835 |
| 2023 | $12,649 | $61,502 | $6,089 | $55,413 |
| 2022 | $12,649 | $61,502 | $6,089 | $55,413 |
| 2021 | $13,605 | $67,657 | $6,088 | $61,569 |
| 2020 | $10,668 | $47,887 | $6,088 | $41,799 |
| 2019 | $14,352 | $71,432 | $6,088 | $65,344 |
| 2018 | $15,982 | $71,432 | $6,088 | $65,344 |
| 2017 | $14,771 | $61,000 | $5,073 | $55,927 |
| 2016 | $14,850 | $65,547 | $5,073 | $60,474 |
| 2015 | $13,715 | $65,547 | $5,073 | $60,474 |
| 2014 | $10,799 | $50,958 | $5,073 | $45,885 |
| 2013 | -- | $42,811 | $5,073 | $37,738 |
Source: Public Records
Map
Nearby Homes
- 7437 S Merrill Ave
- 7440 S Oglesby Ave
- 7444 S Merrill Ave
- 7522 S Merrill Ave
- 7526 S Merrill Ave
- 7347 S Paxton Ave
- 7427 S Oglesby Ave
- 7537 S Clyde Ave
- 7643 S Paxton Ave
- 7539 S Yates Blvd
- 7317 S Luella Ave
- 7543 S Yates Blvd
- 7517 S Chappel Ave
- 7621 S Clyde Ave
- 7642 S Merrill Ave
- 6859 S Paxton Ave Unit 3
- 7723 S Paxton Ave
- 7716 S Paxton Ave
- 2445 E 74th Place
- 7308 S Yates Blvd Unit 1
- 2224 E 75th St
- 2214 E 75th St
- 7450 S Luella Ave
- 7446 S Luella Ave Unit 2
- 7446 S Luella Ave Unit 1
- 7446 S Luella Ave Unit G
- 7442 S Luella Ave
- 2234 E 75th St
- 2223 E 75th St
- 7438 S Luella Ave Unit 2
- 7438 S Luella Ave
- 2221 E 75th St
- 7447 S Luella Ave
- 2219 E 75th St
- 7434 S Luella Ave
- 2235 E 75th St
- 7443 S Paxton Ave
- 7443 S Paxton Ave Unit 3rd Floor
- 7430 S Luella Ave
- 7439 S Luella Ave