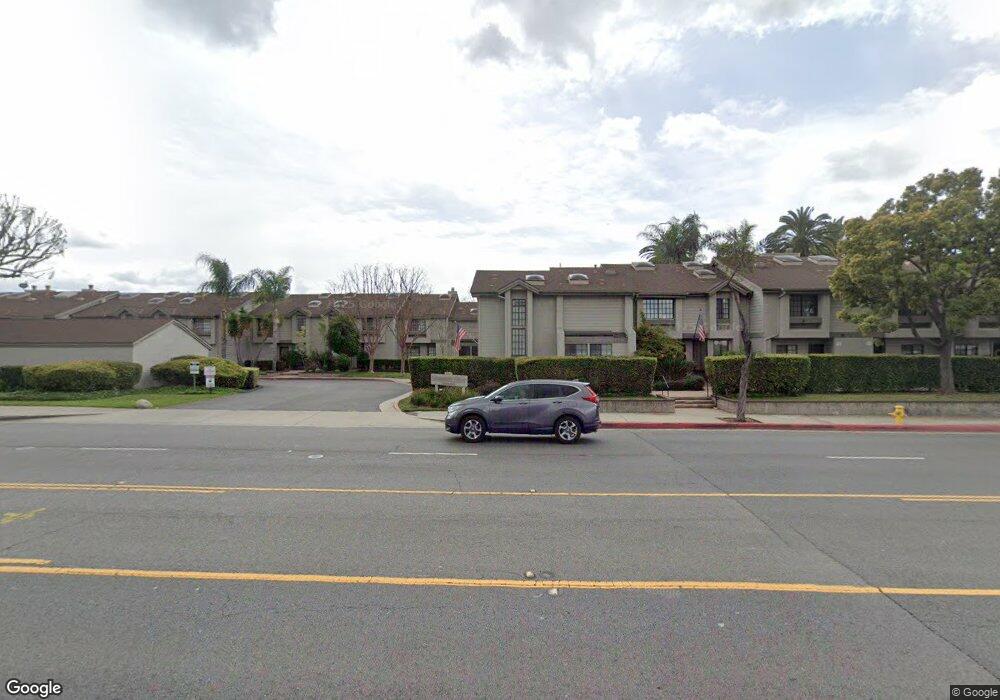
2220 E Chapman Ave Unit 24 Fullerton, CA 92831
Estimated Value: $600,000 - $784,000
2
Beds
2
Baths
1,200
Sq Ft
$559/Sq Ft
Est. Value
About This Home
This home is located at 2220 E Chapman Ave Unit 24, Fullerton, CA 92831 and is currently estimated at $670,565, approximately $558 per square foot. 2220 E Chapman Ave Unit 24 is a home located in Orange County with nearby schools including Commonwealth Elementary School, Ladera Vista Junior High School, and Troy High School.
Ownership History
Date
Name
Owned For
Owner Type
Purchase Details
Closed on
Feb 23, 2006
Sold by
Syck David
Bought by
Neal Kathleen A
Current Estimated Value
Purchase Details
Closed on
Nov 18, 2002
Sold by
Guthrie Robin
Bought by
Syck David
Home Financials for this Owner
Home Financials are based on the most recent Mortgage that was taken out on this home.
Original Mortgage
$86,000
Interest Rate
6.12%
Purchase Details
Closed on
Mar 4, 1997
Sold by
Federal Home Loan Mortgage Corporation
Bought by
Syck David and Guthrie Robin
Home Financials for this Owner
Home Financials are based on the most recent Mortgage that was taken out on this home.
Original Mortgage
$98,400
Interest Rate
7.81%
Purchase Details
Closed on
Aug 2, 1995
Sold by
Jolley Sandra L
Bought by
Federal Home Loan Mortgage Corporation
Create a Home Valuation Report for This Property
The Home Valuation Report is an in-depth analysis detailing your home's value as well as a comparison with similar homes in the area
Purchase History
| Date | Buyer | Sale Price | Title Company |
|---|---|---|---|
| Neal Kathleen A | $440,000 | Multiple | |
| Syck David | -- | United Title Company | |
| Syck David | $123,000 | First American Title Ins Co | |
| Federal Home Loan Mortgage Corporation | $119,000 | First American Title Ins Co |
Source: Public Records
Mortgage History
| Date | Status | Borrower | Loan Amount |
|---|---|---|---|
| Previous Owner | Syck David | $86,000 | |
| Previous Owner | Syck David | $98,400 |
Source: Public Records
Tax History
| Year | Tax Paid | Tax Assessment Tax Assessment Total Assessment is a certain percentage of the fair market value that is determined by local assessors to be the total taxable value of land and additions on the property. | Land | Improvement |
|---|---|---|---|---|
| 2025 | $6,600 | $601,286 | $433,603 | $167,683 |
| 2024 | $6,600 | $589,497 | $425,101 | $164,396 |
| 2023 | $5,352 | $475,462 | $345,244 | $130,218 |
| 2022 | $5,314 | $466,140 | $338,475 | $127,665 |
| 2021 | $5,221 | $457,000 | $331,838 | $125,162 |
| 2020 | $5,242 | $457,000 | $331,838 | $125,162 |
| 2019 | $5,202 | $457,000 | $331,838 | $125,162 |
| 2018 | $4,463 | $387,000 | $261,838 | $125,162 |
| 2017 | $4,470 | $387,000 | $261,838 | $125,162 |
| 2016 | $4,210 | $364,000 | $238,838 | $125,162 |
| 2015 | $3,617 | $314,000 | $188,838 | $125,162 |
| 2014 | $3,578 | $314,000 | $188,838 | $125,162 |
Source: Public Records
Map
Nearby Homes
- 2220 E Chapman Ave Unit 51
- 219 Ladera Vista Dr
- 400 N Acacia Ave Unit B10
- 400 N Acacia Ave Unit A13
- 400 N Acacia Ave Unit D16
- 400 N Acacia Ave Unit C33
- 400 N Acacia Ave Unit B24
- 400 N Acacia Ave Unit B12
- 313 N Acacia Ave
- 1736 E Commonwealth Ave Unit 102
- 2428 Santa Clara Ave
- 1740 E Commonwealth Ave Unit 101
- 1752 E Commonwealth Ave Unit 102
- 1768 E Commonwealth Ave Unit 104
- 2500 Santa Ysabel Ave
- 2518 Pearson Ave
- 2470 Santa Clara Ave
- 2601 Santa Ysabel Ave
- 2033 E Fern Dr
- 2013 Victoria Dr
- 2220 E Chapman Ave
- 2220 E Chapman Ave Unit 34
- 2220 E Chapman Ave Unit 25
- 2220 E Chapman Ave Unit 21
- 2220 E Chapman Ave Unit 20
- 2220 E Chapman Ave Unit 26
- 2220 E Chapman Ave Unit 31
- 2220 E Chapman Ave Unit 53
- 2220 E Chapman Ave Unit 53
- 2220 E Chapman Ave Unit 44
- 2220 E Chapman Ave Unit 18
- 2220 E Chapman Ave Unit 17
- 2220 E Chapman Ave Unit 30
- 2220 E Chapman Ave Unit 55
- 2220 E Chapman Ave Unit 15
- 2220 E Chapman Ave Unit 6
- 2220 E Chapman Ave Unit 33
- 2220 E Chapman Ave Unit 35
- 2220 E Chapman Ave Unit 23
- 2220 E Chapman Ave Unit 49
Your Personal Tour Guide
Ask me questions while you tour the home.