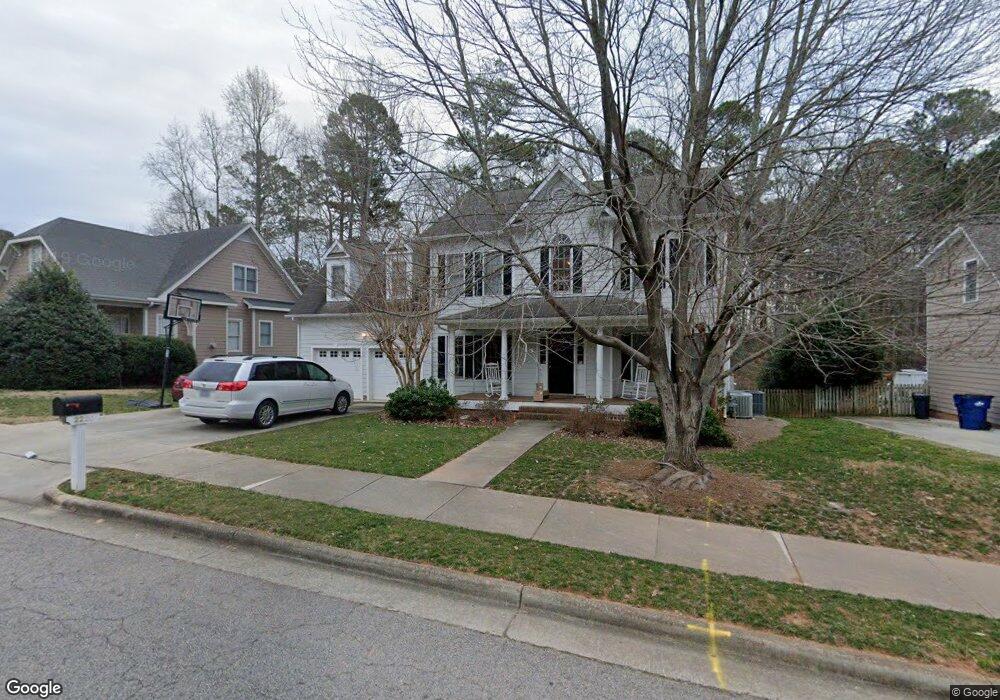
2220 Hollowgate Rd Raleigh, NC 27614
Estimated Value: $527,000 - $659,000
3
Beds
3
Baths
2,370
Sq Ft
$260/Sq Ft
Est. Value
About This Home
This home is located at 2220 Hollowgate Rd, Raleigh, NC 27614 and is currently estimated at $615,886, approximately $259 per square foot. 2220 Hollowgate Rd is a home located in Wake County with nearby schools including Abbotts Creek Elementary School, Wakefield Middle, and Wakefield High School.
Ownership History
Date
Name
Owned For
Owner Type
Purchase Details
Closed on
Dec 10, 1999
Sold by
Parker & Lancaster Corp
Bought by
Clark P Neal and Clark Terah C
Current Estimated Value
Home Financials for this Owner
Home Financials are based on the most recent Mortgage that was taken out on this home.
Original Mortgage
$182,400
Outstanding Balance
$57,660
Interest Rate
7.99%
Estimated Equity
$558,226
Purchase Details
Closed on
Dec 9, 1999
Sold by
Builder Resource & Development Co
Bought by
Parker & Lancaster Corp
Home Financials for this Owner
Home Financials are based on the most recent Mortgage that was taken out on this home.
Original Mortgage
$182,400
Outstanding Balance
$57,660
Interest Rate
7.99%
Estimated Equity
$558,226
Purchase Details
Closed on
Nov 9, 1998
Sold by
Falls River Development Assoc Ii Ltd Par
Bought by
Builder Resource & Development Co Lp
Create a Home Valuation Report for This Property
The Home Valuation Report is an in-depth analysis detailing your home's value as well as a comparison with similar homes in the area
Home Values in the Area
Average Home Value in this Area
Purchase History
| Date | Buyer | Sale Price | Title Company |
|---|---|---|---|
| Clark P Neal | $229,500 | -- | |
| Parker & Lancaster Corp | -- | -- | |
| Builder Resource & Development Co Lp | $92,500 | -- |
Source: Public Records
Mortgage History
| Date | Status | Borrower | Loan Amount |
|---|---|---|---|
| Open | Clark P Neal | $182,400 |
Source: Public Records
Tax History Compared to Growth
Tax History
| Year | Tax Paid | Tax Assessment Tax Assessment Total Assessment is a certain percentage of the fair market value that is determined by local assessors to be the total taxable value of land and additions on the property. | Land | Improvement |
|---|---|---|---|---|
| 2025 | $5,172 | $590,754 | $135,000 | $455,754 |
| 2024 | $5,151 | $590,754 | $135,000 | $455,754 |
| 2023 | $4,220 | $385,303 | $91,000 | $294,303 |
| 2022 | $3,921 | $385,303 | $91,000 | $294,303 |
| 2021 | $3,769 | $385,303 | $91,000 | $294,303 |
| 2020 | $3,700 | $385,303 | $91,000 | $294,303 |
| 2019 | $3,939 | $338,161 | $86,000 | $252,161 |
| 2018 | $3,715 | $338,161 | $86,000 | $252,161 |
| 2017 | $3,538 | $338,161 | $86,000 | $252,161 |
| 2016 | $0 | $338,161 | $86,000 | $252,161 |
| 2015 | -- | $337,706 | $86,000 | $251,706 |
| 2014 | -- | $337,706 | $86,000 | $251,706 |
Source: Public Records
Map
Nearby Homes
- 2136 Dunn Rd
- 10907 Flower Bed Ct
- 1804 Falls Landing Dr
- 1808 Falls Landing Dr
- 4406 Crystal Breeze St
- 10415 Ashmead Ln
- 4615 All Points View Way
- 10821 Farmville Rd
- 1911 Falls Landing Dr Unit 103
- 1911 Falls Landing Dr Unit 106
- 4720 All Points View Way
- 2051 Dunn Rd
- 2110 Piney Brook Rd Unit 104
- 2101 Piney Brook Rd Unit 102
- 2061 Hopeton Ave
- 2111 Piney Brook Rd Unit 101
- 10621 Catara Dr
- 11130 Gwynn Oaks Dr Unit 106
- 10943 Pendragon Place
- 1700 Southwell Ct
- 2216 Hollowgate Rd
- 2224 Hollowgate Rd
- 2212 Hollowgate Rd
- 2228 Hollowgate Rd
- 10801 Matson Place
- 2215 Hollowgate Rd
- 10709 Peppermill Dr
- 10705 Peppermill Dr
- 2232 Hollowgate Rd
- 2208 Hollowgate Rd
- 10800 Matson Place
- 2209 Hollowgate Rd
- 10805 Matson Place
- 10701 Peppermill Dr
- 10706 Collinsworth Ct
- 2213 Saltree Place
- 10801 Peppermill Dr
- 10627 Peppermill Dr
- 2204 Hollowgate Rd
- 2217 Saltree Place