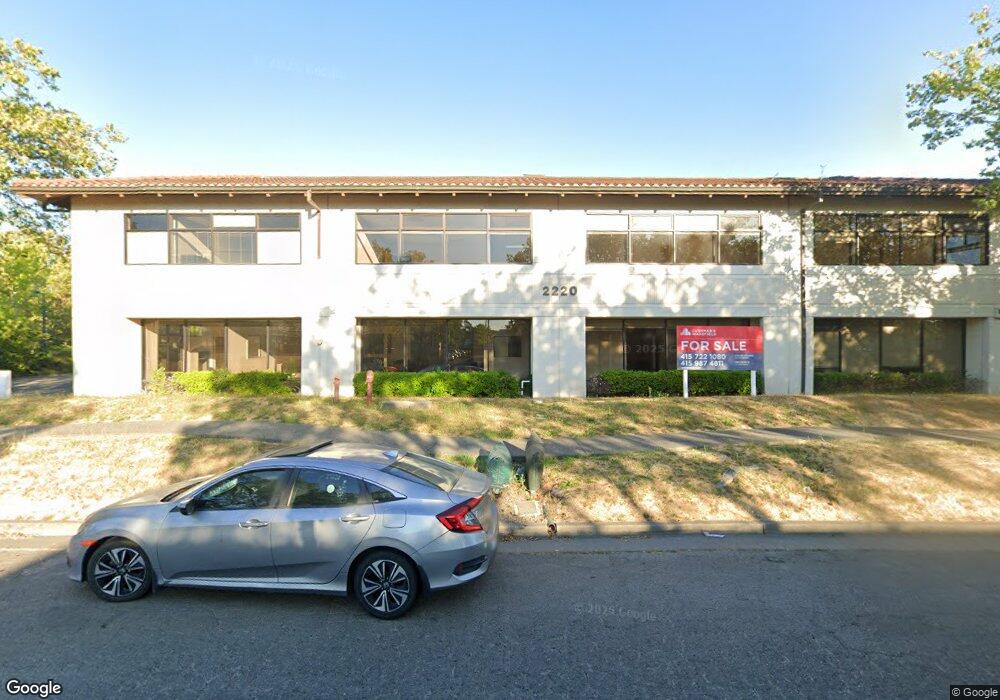
2220 Pine View Way Unit D Petaluma, CA 94954
Waterfront NeighborhoodEstimated Value: $5,015,604
--
Bed
--
Bath
20,366
Sq Ft
$246/Sq Ft
Est. Value
About This Home
This home is located at 2220 Pine View Way Unit D, Petaluma, CA 94954 and is currently estimated at $5,015,604, approximately $246 per square foot. 2220 Pine View Way Unit D is a home located in Sonoma County with nearby schools including Kenilworth Junior High School, Casa Grande High School, and River Montessori Elementary Charter School.
Ownership History
Date
Name
Owned For
Owner Type
Purchase Details
Closed on
Nov 28, 2017
Sold by
Thane Llc
Bought by
Mt Tam Investments Llc
Current Estimated Value
Home Financials for this Owner
Home Financials are based on the most recent Mortgage that was taken out on this home.
Original Mortgage
$3,750,000
Outstanding Balance
$3,152,261
Interest Rate
3.88%
Mortgage Type
Commercial
Estimated Equity
$1,863,343
Purchase Details
Closed on
May 1, 2016
Sold by
Rss
Bought by
Thane Llc
Purchase Details
Closed on
Jan 1, 2015
Sold by
Scott Robert J and Scott Bruce W
Bought by
Rss
Purchase Details
Closed on
Feb 19, 1988
Bought by
Thane Llc
Create a Home Valuation Report for This Property
The Home Valuation Report is an in-depth analysis detailing your home's value as well as a comparison with similar homes in the area
Home Values in the Area
Average Home Value in this Area
Purchase History
| Date | Buyer | Sale Price | Title Company |
|---|---|---|---|
| Mt Tam Investments Llc | $3,750,000 | Fidelity National Title Comp | |
| Thane Llc | -- | None Available | |
| Thane Llc | -- | None Available | |
| Rss | -- | None Available | |
| Scott Robert J | $270,000 | None Available | |
| Thane Llc | $982,000 | -- |
Source: Public Records
Mortgage History
| Date | Status | Borrower | Loan Amount |
|---|---|---|---|
| Open | Mt Tam Investments Llc | $3,750,000 |
Source: Public Records
Tax History Compared to Growth
Tax History
| Year | Tax Paid | Tax Assessment Tax Assessment Total Assessment is a certain percentage of the fair market value that is determined by local assessors to be the total taxable value of land and additions on the property. | Land | Improvement |
|---|---|---|---|---|
| 2025 | $46,310 | $4,266,855 | $1,280,056 | $2,986,799 |
| 2024 | $46,310 | $4,183,192 | $1,254,957 | $2,928,235 |
| 2023 | $46,310 | $4,101,169 | $1,230,350 | $2,870,819 |
| 2022 | $45,239 | $4,020,755 | $1,206,226 | $2,814,529 |
| 2021 | $44,709 | $3,941,918 | $1,182,575 | $2,759,343 |
| 2020 | $45,031 | $3,901,500 | $1,170,450 | $2,731,050 |
| 2019 | $44,571 | $3,825,000 | $1,147,500 | $2,677,500 |
| 2018 | $43,260 | $2,082,920 | $497,950 | $1,584,970 |
| 2017 | $23,713 | $2,042,080 | $488,187 | $1,553,893 |
| 2016 | $23,017 | $2,002,040 | $478,615 | $1,523,425 |
| 2015 | $22,416 | $1,971,968 | $471,426 | $1,500,542 |
| 2014 | $22,191 | $1,933,341 | $462,192 | $1,471,149 |
Source: Public Records
Map
Nearby Homes
- 4091 Lakeville Hwy
- 1727 Chinar Dr
- 1694 Southridge Dr
- 1180 Wieling Way
- 12 Birnam Wood Ct
- 1878 Adobe Creek Dr
- 2014 Crinella Dr
- 1917 Falcon Ridge Dr
- 2 Wedgewood Ct
- 1052 Helen Ct
- 1158 San Rafael Dr
- 1513 Elizabeth Dr
- 1821 Lakeville Hwy Unit 77
- 4 Starling Dr
- 3 Lapis Ct
- 1103 Marylyn Cir
- 859 S Mcdowell Blvd
- 602 Marylyn Cir
- 601 Marylyn Cir Unit 21
- 2189 Saint Augustine Cir
- 0 Cypress Dr
- 3830 Cypress Dr
- 3820 Cypress Dr Unit 1
- 7630 Lakeville Hwy
- 0 Lakeville Hwy
- 4039 Lakeville Hwy
- 1676 Southview Dr
- 1680 Southview Dr
- 1684 Southview Dr
- 1688 Southview Dr
- 1751 Chinar Dr
- 1679 Southview Dr
- 1692 Southview Dr
- 1747 Chinar Dr
- 1683 Southview Dr
- 1743 Chinar Dr
- 1696 Southview Dr
- 1687 Southview Dr
- 1739 Chinar Dr
- 1691 Southview Dr