Estimated Value: $394,000 - $660,000
3
Beds
2
Baths
2,280
Sq Ft
$253/Sq Ft
Est. Value
About This Home
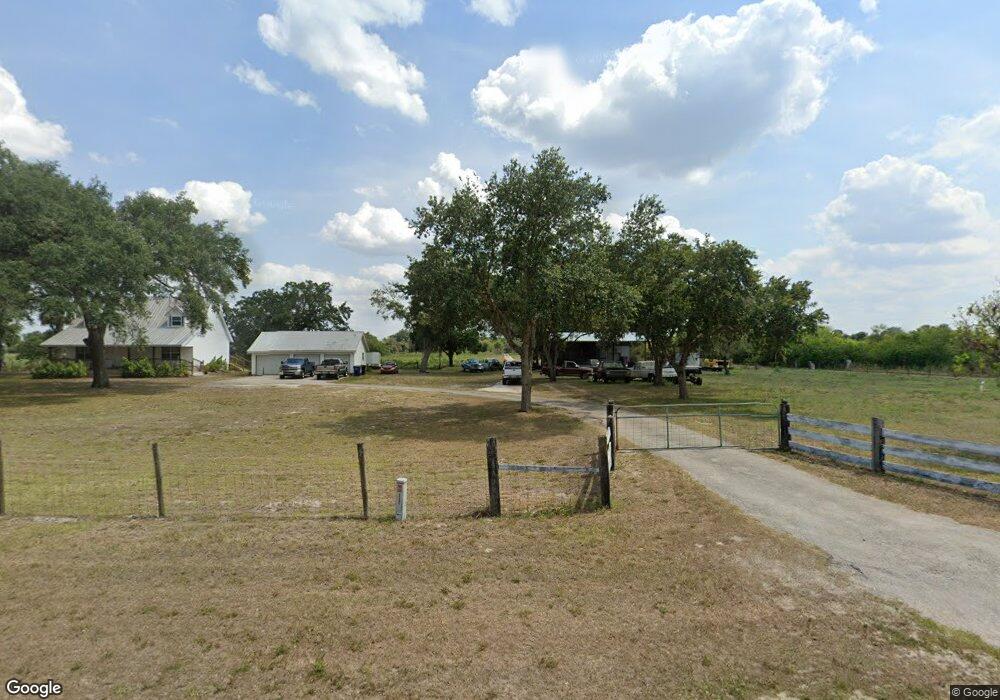
This home is located at 22200 N River Rd, Alva, FL 33920 and is currently estimated at $576,714, approximately $252 per square foot. 22200 N River Rd is a home located in Lee County with nearby schools including The Alva School, Lehigh Elementary School, and Orange River Elementary School.
Ownership History
Date
Name
Owned For
Owner Type
Purchase Details
Closed on
Mar 5, 2024
Sold by
Nse West Llc
Bought by
Stanford John Vincent
Current Estimated Value
Purchase Details
Closed on
Oct 16, 2012
Sold by
Federal National Mortgage Association
Bought by
N S E West Llc
Purchase Details
Closed on
Apr 10, 2012
Sold by
Mckenzie James J
Bought by
Federal National Mortgage Association
Purchase Details
Closed on
May 31, 2000
Sold by
Williams Robert E and Williams Elinor B
Bought by
Mckenzie James J and Mckenzie Debra A
Home Financials for this Owner
Home Financials are based on the most recent Mortgage that was taken out on this home.
Original Mortgage
$88,000
Interest Rate
8.14%
Purchase Details
Closed on
Apr 5, 1999
Sold by
Clerk Circuit Court
Bought by
Williams Robert E and Williams Elinor B
Create a Home Valuation Report for This Property
The Home Valuation Report is an in-depth analysis detailing your home's value as well as a comparison with similar homes in the area
Home Values in the Area
Average Home Value in this Area
Purchase History
| Date | Buyer | Sale Price | Title Company |
|---|---|---|---|
| Stanford John Vincent | $575,000 | Superior Title | |
| N S E West Llc | $114,900 | Attorney | |
| Federal National Mortgage Association | -- | None Available | |
| Mckenzie James J | $108,000 | -- | |
| Williams Robert E | -- | -- |
Source: Public Records
Mortgage History
| Date | Status | Borrower | Loan Amount |
|---|---|---|---|
| Previous Owner | Mckenzie James J | $88,000 |
Source: Public Records
Tax History
| Year | Tax Paid | Tax Assessment Tax Assessment Total Assessment is a certain percentage of the fair market value that is determined by local assessors to be the total taxable value of land and additions on the property. | Land | Improvement |
|---|---|---|---|---|
| 2025 | $6,319 | $503,596 | $503,596 | -- |
| 2024 | $6,319 | $257,721 | -- | -- |
| 2023 | $6,185 | $234,292 | $0 | $0 |
| 2022 | $5,619 | $212,993 | $0 | $0 |
| 2021 | $4,627 | $429,697 | $304,000 | $125,697 |
| 2020 | $2,894 | $176,027 | $148,000 | $28,027 |
| 2019 | $2,878 | $174,420 | $148,000 | $26,420 |
| 2018 | $2,914 | $176,028 | $148,000 | $28,028 |
| 2017 | $2,743 | $163,114 | $104,000 | $59,114 |
| 2016 | $2,861 | $193,502 | $104,000 | $89,502 |
| 2015 | $2,672 | $174,901 | $86,400 | $88,501 |
| 2014 | -- | $117,410 | $73,600 | $43,810 |
| 2013 | -- | $56,582 | $20,258 | $36,324 |
Source: Public Records
Map
Nearby Homes
- 22 Ashe St
- 15 Ilex St
- 30 Aloe St
- 10 Hay St
- 9 Elder St
- 7 Elder St
- 1 Elder St
- 4 Elder St
- 22800 N River Rd
- 22728 Yellow Button Ln
- 21810 Pearl St
- 22742 Yellow Button Ln
- 22797 Yellow Button Ln
- 22821 Yellow Button Ln
- 22776 Yellow Button Ln
- 21521 Center St
- 21531 Pearl St
- 2110 Silk Bay Blvd
- 2107 Silk Bay Blvd
- 2121 Silk Bay Blvd Unit 90
Your Personal Tour Guide
Ask me questions while you tour the home.