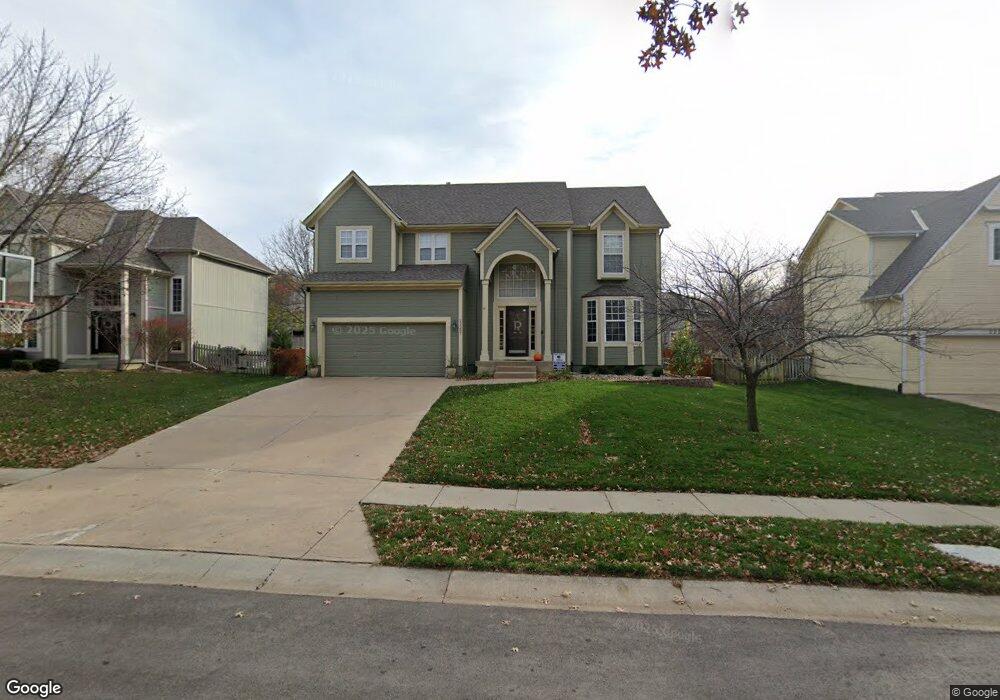
22207 W 52nd St Shawnee, KS 66226
Estimated Value: $473,942 - $486,000
5
Beds
4
Baths
2,545
Sq Ft
$189/Sq Ft
Est. Value
About This Home
This home is located at 22207 W 52nd St, Shawnee, KS 66226 and is currently estimated at $481,486, approximately $189 per square foot. 22207 W 52nd St is a home located in Johnson County with nearby schools including Prairie Ridge Elementary School, Monticello Trails Middle School, and Mill Valley High School.
Ownership History
Date
Name
Owned For
Owner Type
Purchase Details
Closed on
Oct 14, 2010
Sold by
Robins Jody A and Robins Stacy L
Bought by
Robins Stacy L
Current Estimated Value
Purchase Details
Closed on
Aug 11, 2006
Sold by
Johnston Mark A and Johnston Wilma T
Bought by
Robins Jody A and Robins Stacy L
Home Financials for this Owner
Home Financials are based on the most recent Mortgage that was taken out on this home.
Original Mortgage
$25,540
Interest Rate
6.41%
Mortgage Type
Stand Alone Second
Purchase Details
Closed on
Jan 28, 2005
Sold by
Johnston Mark A and Johnston Wilma T
Bought by
Johnston Mark A and Johnston Wilma T
Create a Home Valuation Report for This Property
The Home Valuation Report is an in-depth analysis detailing your home's value as well as a comparison with similar homes in the area
Home Values in the Area
Average Home Value in this Area
Purchase History
| Date | Buyer | Sale Price | Title Company |
|---|---|---|---|
| Robins Stacy L | -- | Valore Title | |
| Robins Jody A | -- | Chicago Title Insurance Co | |
| Johnston Mark A | -- | None Available |
Source: Public Records
Mortgage History
| Date | Status | Borrower | Loan Amount |
|---|---|---|---|
| Closed | Robins Jody A | $25,540 | |
| Open | Robins Jody A | $204,320 |
Source: Public Records
Tax History Compared to Growth
Tax History
| Year | Tax Paid | Tax Assessment Tax Assessment Total Assessment is a certain percentage of the fair market value that is determined by local assessors to be the total taxable value of land and additions on the property. | Land | Improvement |
|---|---|---|---|---|
| 2024 | $5,456 | $46,943 | $9,850 | $37,093 |
| 2023 | $5,290 | $44,999 | $8,948 | $36,051 |
| 2022 | $4,829 | $40,250 | $7,783 | $32,467 |
| 2021 | $4,533 | $36,294 | $7,066 | $29,228 |
| 2020 | $4,383 | $34,776 | $7,066 | $27,710 |
| 2019 | $4,381 | $34,248 | $6,751 | $27,497 |
| 2018 | $4,050 | $31,372 | $6,096 | $25,276 |
| 2017 | $4,019 | $30,372 | $5,586 | $24,786 |
| 2016 | $4,194 | $31,315 | $5,586 | $25,729 |
| 2015 | $4,071 | $29,877 | $5,586 | $24,291 |
| 2013 | -- | $27,048 | $5,586 | $21,462 |
Source: Public Records
Map
Nearby Homes
- 22115 W 51st Terrace
- 5206 Round Prairie St
- 5116 Payne St
- 21804 W 52nd Terrace
- 5402 Roundtree St
- 22014 W 51st St
- 5408 Aminda St
- 21624 W 53rd Terrace
- 5307 Noble St
- 5531 Hilltop Dr
- 22625 W 49th St
- 22910 W 51st St
- 22714 W 49th St
- 22605 W 56th St
- 22310 W 58th St
- 5311 Brownridge Dr
- 22209 W 57th St
- 22014 W 47th Terrace
- 21408 W 50th St
- 5405 Lakecrest Dr
- 22211 W 52nd St
- 22203 W 52nd St
- 5213 Roundtree St
- 22117 W 52nd St
- 22215 W 52nd St
- 5216 Roundtree St
- 22208 W 52nd St
- 22204 W 52nd St
- 22212 W 52nd St
- 5217 Roundtree St
- 22113 W 52nd St
- 22216 W 52nd St
- 22219 W 52nd St
- 5215 Chouteau St
- 5220 Roundtree St
- 5221 Roundtree St
- 5219 Chouteau St
- 22114 W 52nd St
- 22220 W 52nd St
- 5222 Round Prairie St