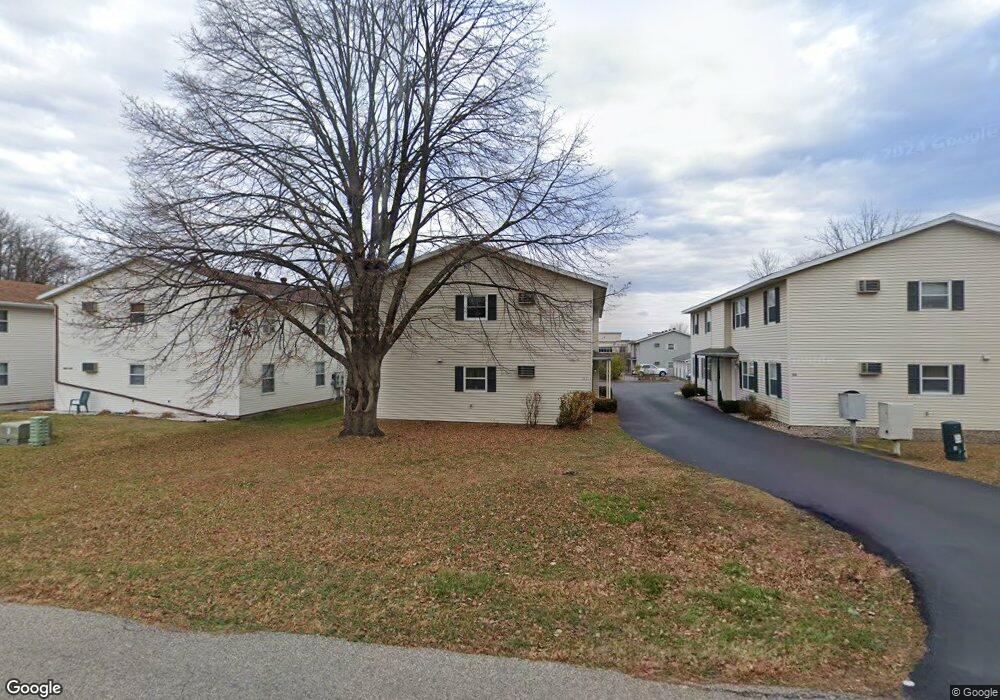
2221 3rd St SW Rochester, MN 55902
Estimated Value: $165,000 - $170,000
2
Beds
1
Bath
840
Sq Ft
$199/Sq Ft
Est. Value
About This Home
This home is located at 2221 3rd St SW, Rochester, MN 55902 and is currently estimated at $167,460, approximately $199 per square foot. 2221 3rd St SW is a home located in Olmsted County with nearby schools including Folwell Elementary School, John Adams Middle School, and Mayo Senior High School.
Ownership History
Date
Name
Owned For
Owner Type
Purchase Details
Closed on
Feb 26, 2021
Sold by
Vargas Omar and Vargas Lauren
Bought by
Equity Trust Company and Dee Harrison Ira
Current Estimated Value
Purchase Details
Closed on
Feb 25, 2021
Sold by
Harrison Dee and Dow Shawn D
Bought by
Vargas Omar
Purchase Details
Closed on
Oct 31, 2019
Sold by
Garry Katarina C A
Bought by
Harrison Dee
Purchase Details
Closed on
Aug 22, 2006
Sold by
Maplestone Julian H
Bought by
Garry Katarina C A
Purchase Details
Closed on
Aug 22, 2005
Sold by
Bauer Hope Lynette
Bought by
Bauer Michael Phillip
Purchase Details
Closed on
May 26, 2005
Sold by
Bauer Michael P and Bauer Caron K
Bought by
Garry Katarina C A and Maplestone Julian H
Home Financials for this Owner
Home Financials are based on the most recent Mortgage that was taken out on this home.
Original Mortgage
$74,205
Interest Rate
5.91%
Mortgage Type
New Conventional
Create a Home Valuation Report for This Property
The Home Valuation Report is an in-depth analysis detailing your home's value as well as a comparison with similar homes in the area
Home Values in the Area
Average Home Value in this Area
Purchase History
| Date | Buyer | Sale Price | Title Company |
|---|---|---|---|
| Equity Trust Company | $115,000 | Hansen Ttl & Legal Svcs Llc | |
| Vargas Omar | $110,000 | Hansen Ttl & Legal Svcs Llc | |
| Harrison Dee | $110,000 | Edina Realty Title Inc | |
| Garry Katarina C A | -- | None Available | |
| Bauer Michael Phillip | -- | None Available | |
| Garry Katarina C A | $76,500 | Holt Title |
Source: Public Records
Mortgage History
| Date | Status | Borrower | Loan Amount |
|---|---|---|---|
| Previous Owner | Garry Katarina C A | $74,205 |
Source: Public Records
Tax History Compared to Growth
Tax History
| Year | Tax Paid | Tax Assessment Tax Assessment Total Assessment is a certain percentage of the fair market value that is determined by local assessors to be the total taxable value of land and additions on the property. | Land | Improvement |
|---|---|---|---|---|
| 2024 | $1,760 | $123,500 | $12,000 | $111,500 |
| 2023 | $1,556 | $123,500 | $12,000 | $111,500 |
| 2022 | $1,312 | $115,400 | $12,000 | $103,400 |
| 2021 | $1,240 | $95,400 | $10,000 | $85,400 |
| 2020 | $880 | $90,000 | $10,000 | $80,000 |
| 2019 | $836 | $86,500 | $10,000 | $76,500 |
| 2018 | $757 | $83,600 | $10,000 | $73,600 |
| 2017 | $720 | $80,500 | $10,000 | $70,500 |
| 2016 | $622 | $44,500 | $6,000 | $38,500 |
| 2015 | $570 | $38,100 | $6,000 | $32,100 |
| 2014 | $562 | $38,100 | $6,000 | $32,100 |
| 2012 | -- | $38,900 | $5,994 | $32,906 |
Source: Public Records
Map
Nearby Homes
- 327 20th Ave SW
- 501 20th Ave SW
- 2005 Hill Place SW
- 405 18 1 2 Ave SW
- 1749 1st St SW
- 17 Conner Cir SW
- 360 Wimbledon Hills Dr SW
- 2472 Gates Dr SW
- 406 18th Ave SW
- 785 Brandon Ln SW
- 625 Folwell Ln SW
- 1744 7th St SW
- 2773 Clover Place SW
- 2001 Folwell Dr SW
- 1516 5th St SW
- 910 Folwell Dr SW
- 1426 1st St NW
- 1728 8th St SW
- 1912 Folwell Dr SW
- 430 15th Ave SW
- 2221 3rd St SW
- 2221 3rd St SW
- 2221 3rd St SW
- 2221 3rd St SW Unit D
- 2221 3rd St SW Unit B
- 2221 3rd St SW Unit C
- 2215 3rd St SW
- 2215 3rd St SW Unit d
- 2225 2225 3rd-Street-sw
- 2225 3rd St SW
- 2233 3rd St SW
- 2233 2233 3rd St SW
- 2239 3rd St SW
- 2237 3rd St SW
- 2235 3rd St SW
- 2218 2nd St SW
- 2218 2nd St SW
- 2218 2nd St SW
- 2218 2nd St SW
- 2237 2237 3rd-Street-sw