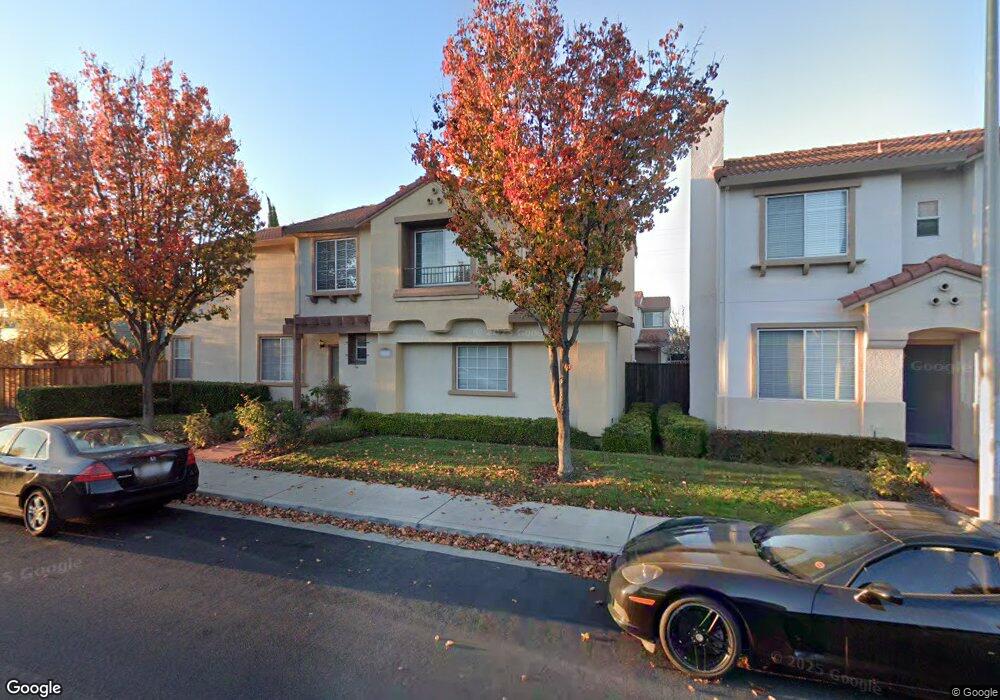
2221 Gianera St Santa Clara, CA 95054
North Santa Clara NeighborhoodEstimated Value: $1,491,623 - $1,593,000
3
Beds
3
Baths
1,473
Sq Ft
$1,046/Sq Ft
Est. Value
About This Home
This home is located at 2221 Gianera St, Santa Clara, CA 95054 and is currently estimated at $1,540,656, approximately $1,045 per square foot. 2221 Gianera St is a home located in Santa Clara County with nearby schools including Kathryn Hughes Elementary School, Buchser Middle School, and Santa Clara High School.
Ownership History
Date
Name
Owned For
Owner Type
Purchase Details
Closed on
May 19, 2005
Sold by
Lau Fiona
Bought by
Manglicmot Glen L
Current Estimated Value
Home Financials for this Owner
Home Financials are based on the most recent Mortgage that was taken out on this home.
Original Mortgage
$137,000
Interest Rate
5.74%
Mortgage Type
Credit Line Revolving
Purchase Details
Closed on
Apr 28, 1999
Sold by
Lau Pak Cheong
Bought by
Lau Fiona
Purchase Details
Closed on
Oct 12, 1998
Sold by
1St American T Guar Co
Bought by
Lau Fiona
Home Financials for this Owner
Home Financials are based on the most recent Mortgage that was taken out on this home.
Original Mortgage
$240,000
Interest Rate
6.96%
Create a Home Valuation Report for This Property
The Home Valuation Report is an in-depth analysis detailing your home's value as well as a comparison with similar homes in the area
Home Values in the Area
Average Home Value in this Area
Purchase History
| Date | Buyer | Sale Price | Title Company |
|---|---|---|---|
| Manglicmot Glen L | $685,000 | Chicago Title | |
| Lau Fiona | -- | First American Title Guarant | |
| Lau Fiona | $350,000 | First American Title Guarant |
Source: Public Records
Mortgage History
| Date | Status | Borrower | Loan Amount |
|---|---|---|---|
| Closed | Manglicmot Glen L | $137,000 | |
| Previous Owner | Lau Fiona | $240,000 |
Source: Public Records
Tax History Compared to Growth
Tax History
| Year | Tax Paid | Tax Assessment Tax Assessment Total Assessment is a certain percentage of the fair market value that is determined by local assessors to be the total taxable value of land and additions on the property. | Land | Improvement |
|---|---|---|---|---|
| 2025 | $10,934 | $954,816 | $348,469 | $606,347 |
| 2024 | $10,934 | $936,095 | $341,637 | $594,458 |
| 2023 | $10,934 | $917,741 | $334,939 | $582,802 |
| 2022 | $10,640 | $899,747 | $328,372 | $571,375 |
| 2021 | $10,597 | $882,106 | $321,934 | $560,172 |
| 2020 | $10,404 | $873,062 | $318,633 | $554,429 |
| 2019 | $10,389 | $855,944 | $312,386 | $543,558 |
| 2018 | $9,720 | $839,161 | $306,261 | $532,900 |
| 2017 | $9,671 | $822,707 | $300,256 | $522,451 |
| 2016 | $9,463 | $806,576 | $294,369 | $512,207 |
| 2015 | $9,425 | $794,462 | $289,948 | $504,514 |
| 2014 | $7,980 | $693,000 | $252,900 | $440,100 |
Source: Public Records
Map
Nearby Homes
- 2313 Villa Place
- 4676 Wilcox Ave
- 4699 Snead Dr
- 4503 Cheeney St
- 1901 Garzoni Place Unit 405
- 1898 Garzoni Place
- 1883 Agnew Rd Unit 367
- 1883 Agnew Rd Unit 341
- 2200 Agnew Rd Unit 212
- 2200 Agnew Rd Unit 118
- 4216 Atlantic Ct
- 1900 Chestnut St
- 4464 Laird Cir
- 4049 Rio Ct
- 543 Southbay Dr
- 425 Shorewood Ln
- 1031 Clyde Ave Unit 1802
- 504 Summerland Dr Unit 504
- 4098 Biscotti Place Unit 199
- 930 Clyde Ave
- 2223 Gianera St
- 2219 Gianera St
- 2241 Gianera St
- 2217 Gianera St
- 2251 Gianera St
- 2225 Gianera St
- 2231 Gianera St
- 2215 Gianera St
- 2227 Gianera St
- 2271 Gianera St
- 2263 Gianera St Unit 2
- 2261 Gianera St Unit 1
- 2213 Gianera St
- 2211 Gianera St
- 2201 Gianera St
- 2275 Gianera St
- 2281 Gianera St
- 2238 Gianera St
- 2242 Gianera St
- 2285 Gianera St