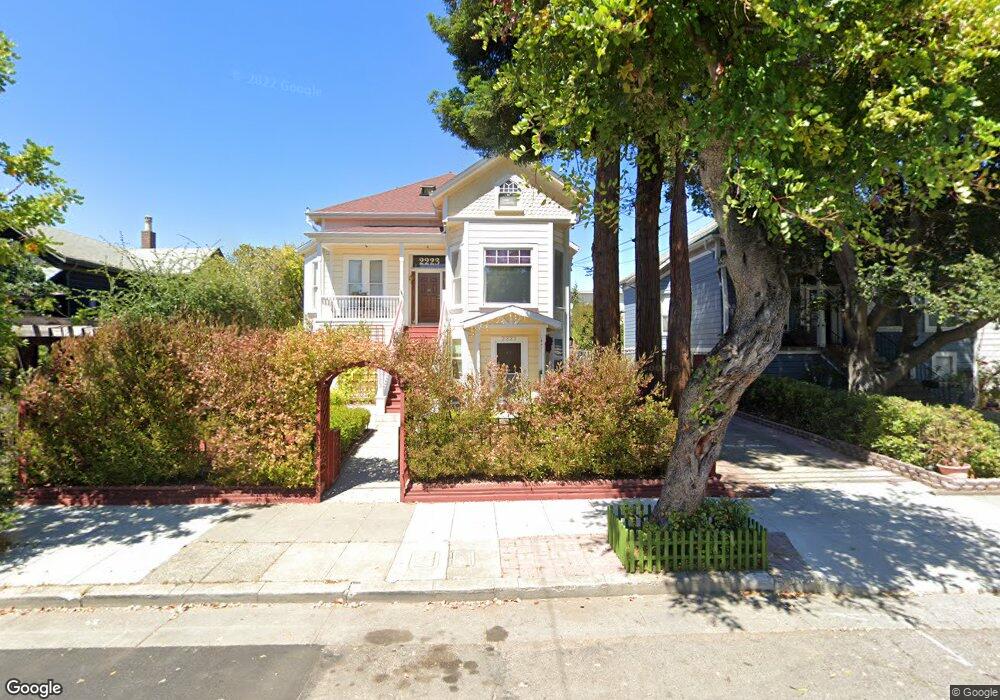
2221 San Jose Ave Alameda, CA 94501
South Shore NeighborhoodEstimated Value: $1,474,000 - $1,871,033
6
Beds
4
Baths
3,788
Sq Ft
$440/Sq Ft
Est. Value
About This Home
This home is located at 2221 San Jose Ave, Alameda, CA 94501 and is currently estimated at $1,665,758, approximately $439 per square foot. 2221 San Jose Ave is a home located in Alameda County with nearby schools including Love Elementary, Will C. Wood Middle School, and Alameda High School.
Ownership History
Date
Name
Owned For
Owner Type
Purchase Details
Closed on
Feb 26, 2017
Sold by
Li Zhao Liang and Li Xiao Lan
Bought by
Li Zhao Liang and Li Xiao Lan
Current Estimated Value
Purchase Details
Closed on
Jun 11, 2002
Sold by
Cope J Hallam and Cope Geneva A
Bought by
Li Zhao Liang and Li Xiao Lan
Home Financials for this Owner
Home Financials are based on the most recent Mortgage that was taken out on this home.
Original Mortgage
$230,000
Interest Rate
6.74%
Purchase Details
Closed on
Oct 28, 1996
Sold by
Smith Deming D and Lonergan Jeanie D
Bought by
Cope J Hallam and Cope Geneva A
Home Financials for this Owner
Home Financials are based on the most recent Mortgage that was taken out on this home.
Original Mortgage
$11,407
Interest Rate
8.11%
Purchase Details
Closed on
Mar 7, 1995
Sold by
Davis Ray E and Davis Cora M
Bought by
Smith Deming D and Lonergan Jeanie D
Home Financials for this Owner
Home Financials are based on the most recent Mortgage that was taken out on this home.
Original Mortgage
$247,000
Interest Rate
9.21%
Mortgage Type
Seller Take Back
Create a Home Valuation Report for This Property
The Home Valuation Report is an in-depth analysis detailing your home's value as well as a comparison with similar homes in the area
Home Values in the Area
Average Home Value in this Area
Purchase History
| Date | Buyer | Sale Price | Title Company |
|---|---|---|---|
| Li Zhao Liang | -- | None Available | |
| Li Zhao Liang | $615,000 | Placer Title Company | |
| Cope J Hallam | -- | Nortwestern Title Company | |
| Smith Deming D | $267,000 | Northwestern Title Co |
Source: Public Records
Mortgage History
| Date | Status | Borrower | Loan Amount |
|---|---|---|---|
| Closed | Li Zhao Liang | $230,000 | |
| Previous Owner | Cope J Hallam | $11,407 | |
| Previous Owner | Smith Deming D | $247,000 |
Source: Public Records
Tax History Compared to Growth
Tax History
| Year | Tax Paid | Tax Assessment Tax Assessment Total Assessment is a certain percentage of the fair market value that is determined by local assessors to be the total taxable value of land and additions on the property. | Land | Improvement |
|---|---|---|---|---|
| 2025 | $13,000 | $956,950 | $272,543 | $691,407 |
| 2024 | $13,000 | $938,052 | $267,200 | $677,852 |
| 2023 | $14,673 | $926,526 | $261,962 | $664,564 |
| 2022 | $14,362 | $901,359 | $256,825 | $651,534 |
| 2021 | $14,032 | $883,550 | $251,790 | $638,760 |
| 2020 | $13,869 | $881,421 | $249,209 | $632,212 |
| 2019 | $12,735 | $864,142 | $244,324 | $619,818 |
| 2018 | $12,426 | $847,202 | $239,534 | $607,668 |
| 2017 | $11,879 | $830,594 | $234,838 | $595,756 |
| 2016 | $11,891 | $814,313 | $230,235 | $584,078 |
| 2015 | $11,849 | $802,085 | $226,778 | $575,307 |
| 2014 | $11,371 | $786,378 | $222,337 | $564,041 |
Source: Public Records
Map
Nearby Homes
- 2308 Encinal Ave
- 2120 Encinal Ave
- 1251 Park St
- 2151 Alameda Ave
- 2209 Otis Dr Unit L
- 840 Oak St
- 2060 San Antonio Ave
- 2119 Alameda Ave
- 954 Park St
- 2137 Otis Dr Unit 322
- 2137 Otis Dr Unit 111
- 935 Park St
- 2417 Marti Rae Ct
- 2216 Santa Clara Ave
- 1100 Park Ave
- 2106 Otis Dr Unit D
- 2031 Otis Dr Unit H
- 2057 Central Ave
- 2133 Santa Clara Ave Unit 217
- 2000 Clinton Ave
- 2217 San Jose Ave
- 2225 San Jose Ave
- 2215 San Jose Ave
- 2231 San Jose Ave
- 2233 San Jose Ave
- 2220 San Antonio Ave
- 2218 San Antonio Ave
- 2228 San Antonio Ave
- 2207 San Jose Ave
- 2237 San Jose Ave
- 2212 San Antonio Ave Unit D
- 2212 San Antonio Ave
- 2220 San Jose Ave
- 2222 San Jose Ave
- 2218 San Jose Ave
- 2208 San Antonio Ave Unit J
- 2214 San Jose Ave
- 2205 San Jose Ave
- 2230 San Jose Ave
- 1012 Walnut St