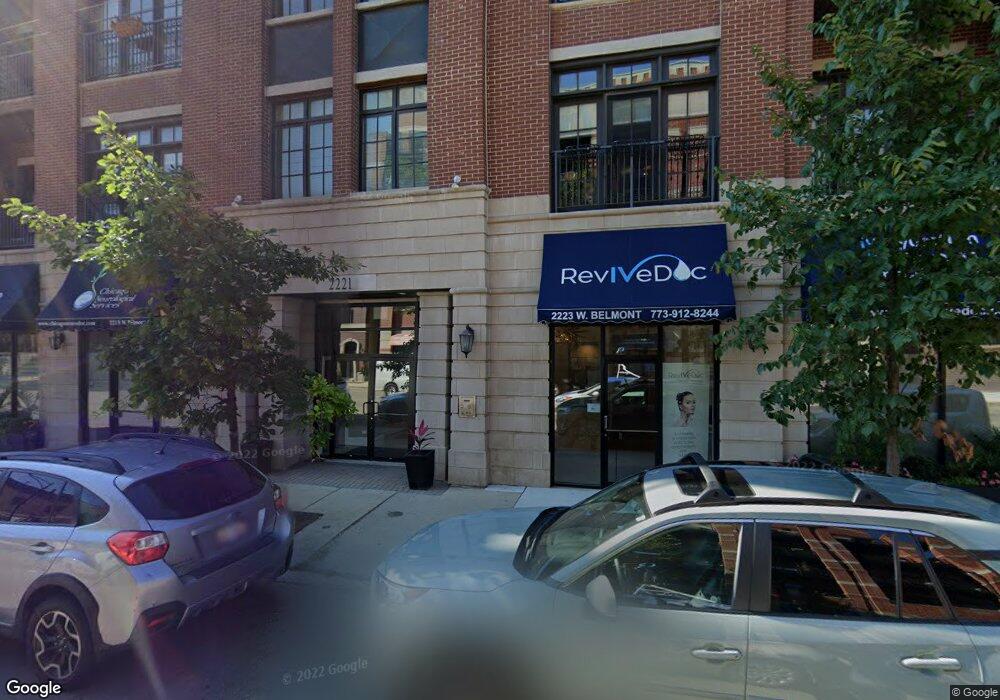
2221 W Belmont Ave Unit 4O1 Chicago, IL 60618
Roscoe Village NeighborhoodEstimated Value: $589,000 - $760,000
3
Beds
2
Baths
25,552
Sq Ft
$26/Sq Ft
Est. Value
About This Home
This home is located at 2221 W Belmont Ave Unit 4O1, Chicago, IL 60618 and is currently estimated at $661,786, approximately $25 per square foot. 2221 W Belmont Ave Unit 4O1 is a home located in Cook County with nearby schools including Jahn School of Fine Arts, Lake View High School, and Saint Luke Academy.
Ownership History
Date
Name
Owned For
Owner Type
Purchase Details
Closed on
Mar 8, 2017
Sold by
Frierott Ryan and Frierott Kristen
Bought by
Girsch Rebecca M and Rebecca M Girsch Revocable Trust
Current Estimated Value
Purchase Details
Closed on
Aug 15, 2014
Sold by
Balsley Stephanee N and Kukankos Matthew
Bought by
Frierott Ryan and Frierott Kristen
Home Financials for this Owner
Home Financials are based on the most recent Mortgage that was taken out on this home.
Original Mortgage
$399,000
Interest Rate
4.37%
Mortgage Type
New Conventional
Purchase Details
Closed on
Mar 25, 2010
Sold by
Pb & J Llc
Bought by
Balsley Stephanee N
Home Financials for this Owner
Home Financials are based on the most recent Mortgage that was taken out on this home.
Original Mortgage
$185,000
Interest Rate
5%
Mortgage Type
New Conventional
Create a Home Valuation Report for This Property
The Home Valuation Report is an in-depth analysis detailing your home's value as well as a comparison with similar homes in the area
Home Values in the Area
Average Home Value in this Area
Purchase History
| Date | Buyer | Sale Price | Title Company |
|---|---|---|---|
| Girsch Rebecca M | $470,000 | None Available | |
| Frierott Ryan | $420,000 | Baird & Warner Title Svcs In | |
| Balsley Stephanee N | $381,000 | None Available |
Source: Public Records
Mortgage History
| Date | Status | Borrower | Loan Amount |
|---|---|---|---|
| Previous Owner | Frierott Ryan | $399,000 | |
| Previous Owner | Balsley Stephanee N | $185,000 |
Source: Public Records
Tax History Compared to Growth
Tax History
| Year | Tax Paid | Tax Assessment Tax Assessment Total Assessment is a certain percentage of the fair market value that is determined by local assessors to be the total taxable value of land and additions on the property. | Land | Improvement |
|---|---|---|---|---|
| 2024 | $9,916 | $50,797 | $8,284 | $42,513 |
| 2023 | $9,667 | $47,000 | $7,775 | $39,225 |
| 2022 | $9,667 | $47,000 | $7,775 | $39,225 |
| 2021 | $9,451 | $46,999 | $7,775 | $39,224 |
| 2020 | $8,880 | $39,863 | $3,206 | $36,657 |
| 2019 | $8,830 | $43,951 | $3,206 | $40,745 |
| 2018 | $8,682 | $43,951 | $3,206 | $40,745 |
| 2017 | $7,793 | $36,199 | $2,805 | $33,394 |
| 2016 | $7,250 | $36,199 | $2,805 | $33,394 |
| 2015 | $6,633 | $36,199 | $2,805 | $33,394 |
| 2014 | $5,353 | $31,419 | $2,154 | $29,265 |
| 2013 | $5,714 | $31,419 | $2,154 | $29,265 |
Source: Public Records
Map
Nearby Homes
- 3140 N Leavitt St
- 2209 W Belmont Ave Unit 3
- 2239 W Belmont Ave Unit 2
- 2222 W Belmont Ave Unit 504
- 2249 W Belmont Ave
- 2149 W Belmont Ave Unit 3W
- 2141 W Belmont Ave Unit 3
- 3107 N Oakley Ave
- 2140 W Belmont Ave Unit 1
- 2130 W Belmont Ave Unit 3A
- 3100 N Clybourn Ave
- 3052 N Oakley Ave Unit 3
- 3052 N Oakley Ave Unit 1
- 3237 N Oakley Ave Unit 2N
- 3137 N Hoyne Ave
- 3040 N Hoyne Ave
- 3306 N Bell Ave
- 2043 W Belmont Ave Unit 3
- 3131 N Western Ave Unit 2
- 3015 N Hamilton Ave
- 2221 W Belmont Ave Unit 404
- 2221 W Belmont Ave Unit 303
- 2221 W Belmont Ave Unit 202
- 2221 W Belmont Ave Unit 204
- 2221 W Belmont Ave Unit 302
- 2221 W Belmont Ave Unit 203
- 2221 W Belmont Ave Unit 201
- 2221 W Belmont Ave Unit 402
- 2221 W Belmont Ave Unit 303
- 2221 W Belmont Ave Unit 204W
- 2221 W Belmont Ave Unit 301
- 2221 W Belmont Ave Unit 403
- 2221 W Belmont Ave Unit 304
- 2221 W Belmont Ave Unit 302
- 2221 W Belmont Ave Unit 203W
- 2221 W Belmont Ave Unit 404
- 2221 W Belmont Ave Unit 202
- 2221 W Belmont Ave Unit C
- 2221 W Belmont Ave Unit 403
- 2221 W Belmont Ave Unit 301