22217 Silverbell Ln Moreno Valley, CA 92553
Towngate NeighborhoodEstimated Value: $622,559 - $696,000
4
Beds
3
Baths
2,816
Sq Ft
$237/Sq Ft
Est. Value
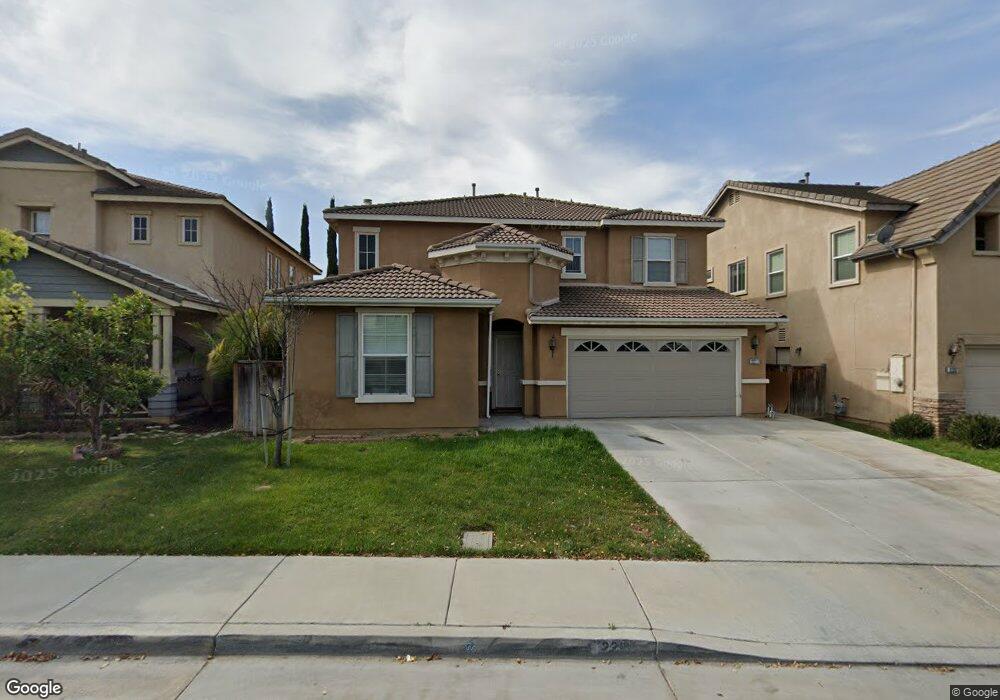
About This Home
This home is located at 22217 Silverbell Ln, Moreno Valley, CA 92553 and is currently estimated at $668,640, approximately $237 per square foot. 22217 Silverbell Ln is a home located in Riverside County with nearby schools including Towngate Elementary School, Sunnymead Middle School, and Moreno Valley High School.
Ownership History
Date
Name
Owned For
Owner Type
Purchase Details
Closed on
Aug 28, 2018
Sold by
Ahmadi Sultan A
Bought by
Ahmadi Sohail
Current Estimated Value
Purchase Details
Closed on
Oct 29, 2008
Sold by
Ahmadi Sultan A and Ahmadi Raihana
Bought by
Ahmadi Sultan A and Ahmadi Sohail
Purchase Details
Closed on
Nov 4, 2002
Sold by
Ahmadi Zubaida
Bought by
Ahmadi Sultan A
Home Financials for this Owner
Home Financials are based on the most recent Mortgage that was taken out on this home.
Original Mortgage
$184,300
Outstanding Balance
$77,040
Interest Rate
6.12%
Estimated Equity
$591,600
Purchase Details
Closed on
Oct 14, 2002
Sold by
Western Pacific Housing Inc
Bought by
Ahmadi Sultan A and Ahmadi Raihana
Home Financials for this Owner
Home Financials are based on the most recent Mortgage that was taken out on this home.
Original Mortgage
$184,300
Outstanding Balance
$77,040
Interest Rate
6.12%
Estimated Equity
$591,600
Create a Home Valuation Report for This Property
The Home Valuation Report is an in-depth analysis detailing your home's value as well as a comparison with similar homes in the area
Home Values in the Area
Average Home Value in this Area
Purchase History
| Date | Buyer | Sale Price | Title Company |
|---|---|---|---|
| Ahmadi Sohail | -- | None Available | |
| Ahmadi Sultan A | -- | None Available | |
| Ahmadi Sultan A | -- | First American Title Co | |
| Ahmadi Sultan A | $230,500 | First American Title Ins Co |
Source: Public Records
Mortgage History
| Date | Status | Borrower | Loan Amount |
|---|---|---|---|
| Open | Ahmadi Sultan A | $184,300 |
Source: Public Records
Tax History
| Year | Tax Paid | Tax Assessment Tax Assessment Total Assessment is a certain percentage of the fair market value that is determined by local assessors to be the total taxable value of land and additions on the property. | Land | Improvement |
|---|---|---|---|---|
| 2025 | $5,676 | $321,063 | $77,646 | $243,417 |
| 2023 | $5,676 | $308,598 | $74,632 | $233,966 |
| 2022 | $5,511 | $302,548 | $73,169 | $229,379 |
| 2021 | $5,426 | $296,617 | $71,735 | $224,882 |
| 2020 | $5,376 | $293,577 | $71,000 | $222,577 |
| 2019 | $5,320 | $287,821 | $69,608 | $218,213 |
| 2018 | $5,233 | $282,179 | $68,245 | $213,934 |
| 2017 | $5,163 | $276,647 | $66,907 | $209,740 |
| 2016 | $5,126 | $271,224 | $65,596 | $205,628 |
| 2015 | $5,075 | $267,152 | $64,611 | $202,541 |
| 2014 | $4,855 | $261,921 | $63,347 | $198,574 |
Source: Public Records
Map
Nearby Homes
- 13091 Acacia Ave
- 22253 Summer Holly Ave
- 13277 Day St
- 22500 Greenwich Ct
- 13490 Hawthorn Ave
- 21840 Cottonwood Ave
- 13611 Elsworth St
- 13139 Kiowa Dr
- 13802 Nolze Place
- 13597 Thunderbird Dr
- 13844 Boeing St
- 23010 Vought St
- 13874 Mcdonnell St
- 22790 Allies Place
- 22740 Kinross Ln
- 22936 Allies Place
- 23314 Lena St
- 12659 Meadbury Dr
- 0 0 Unit ML81996994
- 12098 Riparian Way
- 22207 Silverbell Ln
- 22227 Silverbell Ln
- 22214 Sweetgum Ave
- 22204 Sweetgum Ave
- 22237 Silverbell Ln
- 22224 Sweetgum Ave
- 22194 Sweetgum Ave
- 22234 Sweetgum Ave
- 22247 Silverbell Ln
- 22218 Silverbell Ln
- 22247 Silverbell Ln
- 22187 Silverbell Ln
- 22228 Silverbell Ln
- 22184 Sweetgum Ave
- 22238 Silverbell Ln
- 22244 Sweetgum Ave
- 22177 Silverbell Ln
- 13141 Honeylocust Ave
- 22248 Silverbell Ln
- 22248 Silverbell Ln
Your Personal Tour Guide
Ask me questions while you tour the home.