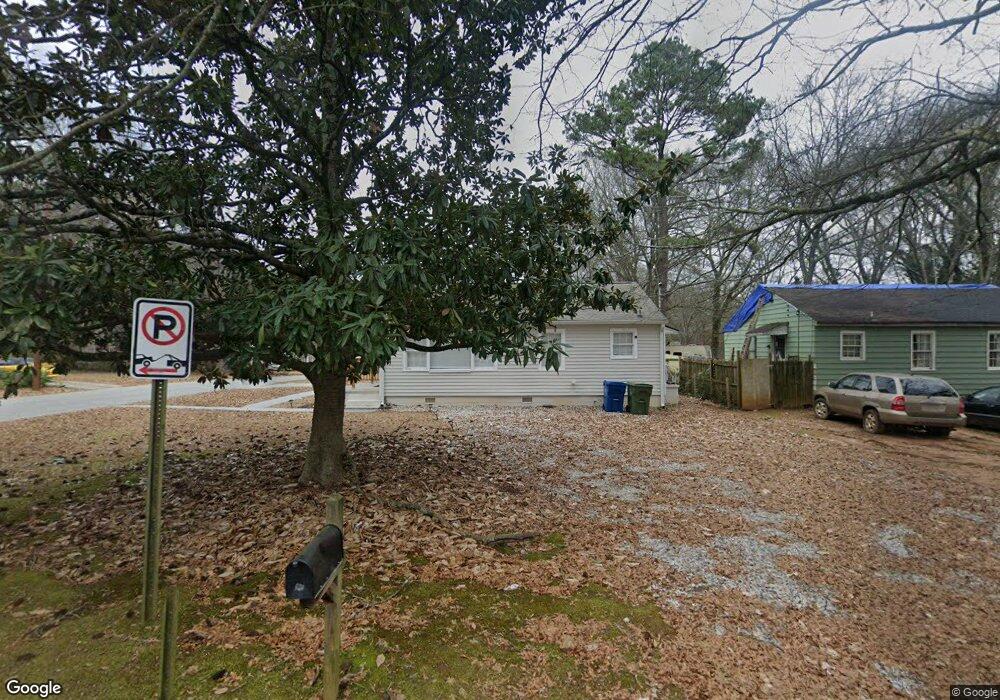
2222 Burroughs Ave SE Atlanta, GA 30315
Lakewood NeighborhoodEstimated Value: $153,000 - $195,000
2
Beds
1
Bath
840
Sq Ft
$204/Sq Ft
Est. Value
About This Home
This home is located at 2222 Burroughs Ave SE, Atlanta, GA 30315 and is currently estimated at $171,498, approximately $204 per square foot. 2222 Burroughs Ave SE is a home located in Fulton County with nearby schools including Dobbs Elementary School, Long Middle School, and South Atlanta High School.
Ownership History
Date
Name
Owned For
Owner Type
Purchase Details
Closed on
May 21, 2021
Sold by
Giant Falcon Iii Llc
Bought by
Vsp Atalnta Llc
Current Estimated Value
Purchase Details
Closed on
Dec 19, 2019
Sold by
Budget Homes Rentals Llc
Bought by
Giant Falcon Iii Llc
Purchase Details
Closed on
May 10, 2017
Sold by
Not Provided
Bought by
Budget Home Rentals Llc
Purchase Details
Closed on
Feb 2, 2015
Sold by
Southeastern Housing Foundatio
Bought by
Gcm Southeastern Llc
Purchase Details
Closed on
Jan 23, 2013
Sold by
Doug Coker Properties Lllp
Bought by
Southeastern Housing Foundatio
Purchase Details
Closed on
Nov 12, 2008
Sold by
2005 Cwalt and 2005 06
Bought by
Doug Coker Properties Lllp
Purchase Details
Closed on
Nov 6, 2007
Sold by
Jones Eugenia
Bought by
Bank Of New York Cwalt 2005 & 06
Create a Home Valuation Report for This Property
The Home Valuation Report is an in-depth analysis detailing your home's value as well as a comparison with similar homes in the area
Home Values in the Area
Average Home Value in this Area
Purchase History
| Date | Buyer | Sale Price | Title Company |
|---|---|---|---|
| Vsp Atalnta Llc | $121,523 | -- | |
| Giant Falcon Iii Llc | $1,545,833 | -- | |
| Budget Home Rentals Llc | $265,500 | -- | |
| Gcm Southeastern Llc | $150,000 | -- | |
| Gcm Southeastern Llc | $150,000 | -- | |
| Southeastern Housing Foundatio | $1,840,000 | -- | |
| Doug Coker Properties Lllp | $18,500 | -- | |
| Bank Of New York Cwalt 2005 & 06 | $60,750 | -- |
Source: Public Records
Tax History Compared to Growth
Tax History
| Year | Tax Paid | Tax Assessment Tax Assessment Total Assessment is a certain percentage of the fair market value that is determined by local assessors to be the total taxable value of land and additions on the property. | Land | Improvement |
|---|---|---|---|---|
| 2025 | $2,478 | $68,440 | $25,360 | $43,080 |
| 2023 | $3,039 | $73,400 | $31,560 | $41,840 |
| 2022 | $1,888 | $46,640 | $10,200 | $36,440 |
| 2021 | $1,363 | $33,640 | $7,280 | $26,360 |
| 2020 | $1,293 | $31,560 | $8,600 | $22,960 |
| 2019 | $488 | $22,600 | $5,280 | $17,320 |
| 2018 | $576 | $13,920 | $4,080 | $9,840 |
| 2017 | $575 | $13,320 | $3,920 | $9,400 |
| 2016 | $577 | $13,320 | $3,920 | $9,400 |
| 2015 | $1,059 | $13,320 | $3,920 | $9,400 |
| 2014 | -- | $13,320 | $3,920 | $9,400 |
Source: Public Records
Map
Nearby Homes
- 2239 Carey Dr SE
- 2242 Jernigan Dr SE
- 2197 Jernigan Dr SE
- 2306 Carey Dr SE
- 2203 Browns Mill Rd SE
- 2126 Jernigan Dr SE
- 2209 Browns Mill Rd SE
- 523 Harper Rd SE
- 2318 Browns Mill Rd SE
- 444 Sargent Dr SE
- 568 Mcwilliams Rd SE
- 2276 Sargent Place SE
- 388 Sargent Dr SE
- 585 Mcwilliams Rd SE Unit 2003
- 585 Mcwilliams Rd SE Unit 1406
- 585 Mcwilliams Rd SE Unit 604
- 2063 Browns Mill Rd SE
- 2117 Blayton Ln SE
- 2228 Burroughs Ave SE
- 2210 Burroughs Ave SE
- 2234 Burroughs Ave SE
- 2221 Carey Dr SE
- 2202 Burroughs Ave SE
- 2240 Burroughs Ave SE
- 2227 Carey Dr SE
- 2200 Carey Dr SE
- 2223 Burroughs Ave SE Unit 2
- 2229 Burroughs Ave SE
- 2233 Carey Dr SE
- 2209 Burroughs Ave SE
- 2196 Burroughs Ave SE
- 2204 Carey Dr SE
- 2246 Burroughs Ave SE
- 2235 Burroughs Ave SE
- 2208 Carey Dr SE
- 2201 Burroughs Ave SE
- 2241 Burroughs Ave SE
- 2190 Burroughs Ave SE