2222 N Euclid Ave Upland, CA 91784
Estimated Value: $1,476,000 - $1,942,000
5
Beds
4
Baths
4,752
Sq Ft
$370/Sq Ft
Est. Value
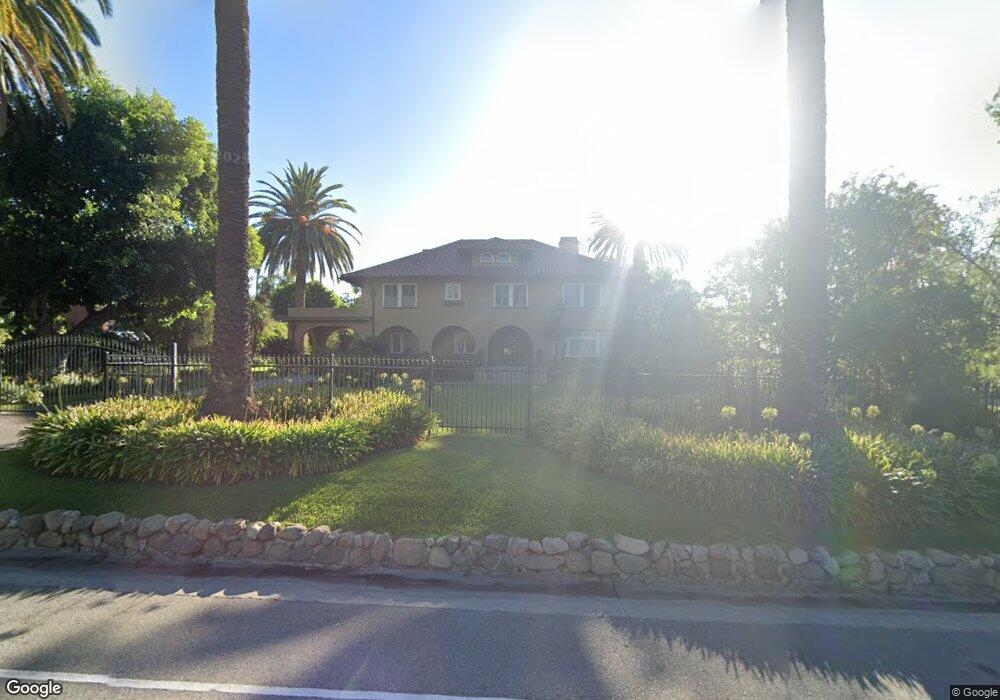
About This Home
This home is located at 2222 N Euclid Ave, Upland, CA 91784 and is currently estimated at $1,757,420, approximately $369 per square foot. 2222 N Euclid Ave is a home located in San Bernardino County with nearby schools including Magnolia Elementary, Pioneer Junior High School, and Upland High School.
Ownership History
Date
Name
Owned For
Owner Type
Purchase Details
Closed on
Jul 22, 2010
Sold by
Loverso Felice L
Bought by
Loverso Felice and Loverso Denise D
Current Estimated Value
Purchase Details
Closed on
Jun 23, 1998
Sold by
Bescoby Mary H
Bought by
Loverso Felice L and Loverso Denise D
Home Financials for this Owner
Home Financials are based on the most recent Mortgage that was taken out on this home.
Original Mortgage
$480,000
Outstanding Balance
$95,025
Interest Rate
6.93%
Estimated Equity
$1,662,395
Purchase Details
Closed on
Nov 3, 1995
Sold by
Bescoby Mary H
Bought by
Bescoby Mary H and Bescoby Family Trust
Purchase Details
Closed on
Jul 1, 1994
Sold by
Bescoby Mary H
Bought by
Bescoby Mary H
Home Financials for this Owner
Home Financials are based on the most recent Mortgage that was taken out on this home.
Original Mortgage
$80,000
Interest Rate
8.53%
Create a Home Valuation Report for This Property
The Home Valuation Report is an in-depth analysis detailing your home's value as well as a comparison with similar homes in the area
Home Values in the Area
Average Home Value in this Area
Purchase History
| Date | Buyer | Sale Price | Title Company |
|---|---|---|---|
| Loverso Felice | -- | None Available | |
| Loverso Felice L | $600,000 | Commonwealth Land Title Co | |
| Bescoby Mary H | -- | -- | |
| Bescoby Mary H | -- | Commonwealth Land Title Co |
Source: Public Records
Mortgage History
| Date | Status | Borrower | Loan Amount |
|---|---|---|---|
| Open | Loverso Felice L | $480,000 | |
| Previous Owner | Bescoby Mary H | $80,000 |
Source: Public Records
Tax History
| Year | Tax Paid | Tax Assessment Tax Assessment Total Assessment is a certain percentage of the fair market value that is determined by local assessors to be the total taxable value of land and additions on the property. | Land | Improvement |
|---|---|---|---|---|
| 2025 | $10,168 | $935,257 | $256,235 | $679,022 |
| 2024 | $9,844 | $916,919 | $251,211 | $665,708 |
| 2023 | $9,696 | $898,940 | $246,285 | $652,655 |
| 2022 | $9,487 | $881,314 | $241,456 | $639,858 |
| 2021 | $9,479 | $864,034 | $236,722 | $627,312 |
| 2020 | $9,221 | $855,175 | $234,295 | $620,880 |
| 2019 | $9,188 | $838,407 | $229,701 | $608,706 |
| 2018 | $8,960 | $821,968 | $225,197 | $596,771 |
| 2017 | $8,701 | $805,851 | $220,781 | $585,070 |
| 2016 | $8,437 | $790,050 | $216,452 | $573,598 |
| 2015 | $8,244 | $778,183 | $213,201 | $564,982 |
| 2014 | $8,031 | $762,940 | $209,025 | $553,915 |
Source: Public Records
Map
Nearby Homes
- 2205 N Euclid Ave
- 2162 N Euclid Ave
- 141 W 21st St
- 2335 N San Antonio Ave
- 2337 N San Antonio Ave
- 1942 N 3rd Ave
- 2464 Prospect Dr
- 2421 Cliff Rd
- 937 Emerson St
- 907 Pineridge St
- 252 W 19th St
- 2487 Cliff Rd
- 2499 Sierra Dr
- 1844 N 1st Ave
- 1837 N 1st Ave
- 7935 Gardenia Ave
- 779 Coral Tree Way
- 1140 W 22nd St
- 256 W 18th St
- 2415 Park Blvd
- 2216 N Euclid Ave
- 2230 N Euclid Ave
- 2225 N 1st Ave
- 2217 N 1st Ave
- 2204 N Euclid Ave
- 2233 N 1st Ave
- 2211 N 1st Ave
- 2248 N Euclid Ave
- 2241 N 1st Ave
- 2205 N 1st Ave
- 2247 N 1st Ave
- 2252 N Euclid Ave
- 2242 N 1st Ave
- 2223 N Euclid Ave
- 2229 N Euclid Ave
- 2215 N Euclid Ave
- 2194 N Euclid Ave
- 2235 N Euclid Ave
- 2257 N 1st Ave
- 2193 N 1st Ave
Your Personal Tour Guide
Ask me questions while you tour the home.