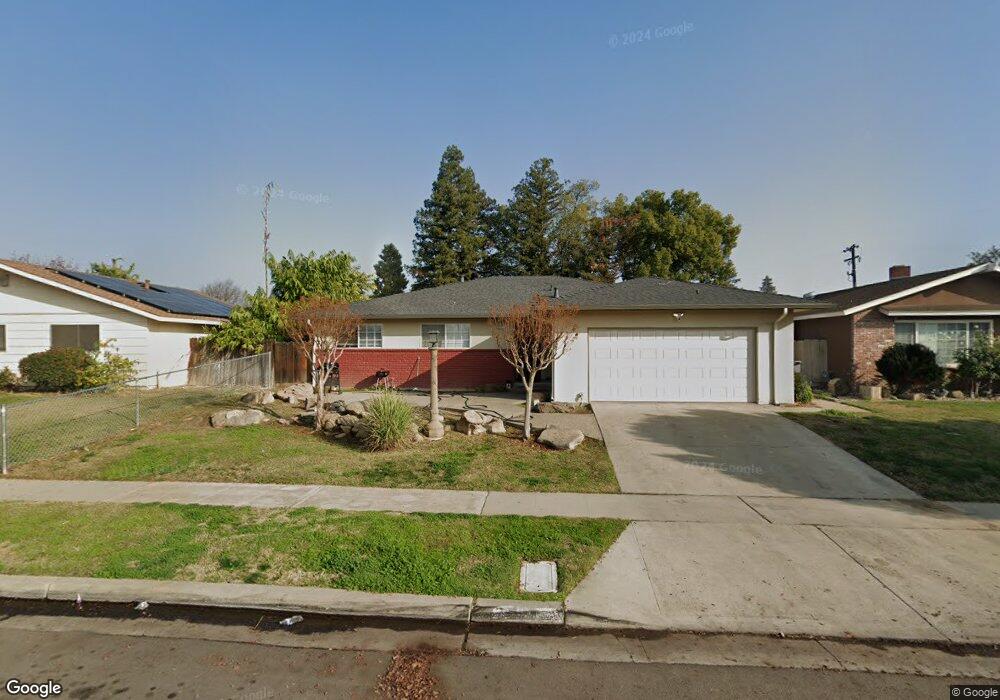
2222 N Laureen Ave Fresno, CA 93703
McLane NeighborhoodEstimated Value: $283,000 - $369,000
3
Beds
2
Baths
1,544
Sq Ft
$215/Sq Ft
Est. Value
About This Home
This home is located at 2222 N Laureen Ave, Fresno, CA 93703 and is currently estimated at $332,121, approximately $215 per square foot. 2222 N Laureen Ave is a home located in Fresno County with nearby schools including Ericson Elementary School, Scandinavian Middle School, and Mclane High School.
Ownership History
Date
Name
Owned For
Owner Type
Purchase Details
Closed on
Jun 20, 2013
Sold by
Pacific Regional Properties L P
Bought by
Pacific Regional Properties L P
Current Estimated Value
Home Financials for this Owner
Home Financials are based on the most recent Mortgage that was taken out on this home.
Original Mortgage
$2,750,000
Interest Rate
3.79%
Mortgage Type
Future Advance Clause Open End Mortgage
Purchase Details
Closed on
Dec 26, 2008
Sold by
Deutsche Bank National Trust Company
Bought by
Pacific Regional Properties Lp
Purchase Details
Closed on
Jul 23, 2008
Sold by
Flores Adriana
Bought by
Deutsche Bank National Trust Co
Purchase Details
Closed on
Dec 29, 2005
Sold by
Saucedo Jose
Bought by
Flores Adriana
Home Financials for this Owner
Home Financials are based on the most recent Mortgage that was taken out on this home.
Original Mortgage
$57,000
Interest Rate
6.25%
Mortgage Type
Stand Alone Second
Purchase Details
Closed on
Dec 27, 2005
Sold by
Cortez Ruben
Bought by
Flores Adriana
Home Financials for this Owner
Home Financials are based on the most recent Mortgage that was taken out on this home.
Original Mortgage
$57,000
Interest Rate
6.25%
Mortgage Type
Stand Alone Second
Purchase Details
Closed on
Oct 23, 2003
Sold by
Her Nao and Vang Khou
Bought by
Saucedo Jose
Home Financials for this Owner
Home Financials are based on the most recent Mortgage that was taken out on this home.
Original Mortgage
$138,400
Interest Rate
7.37%
Mortgage Type
Purchase Money Mortgage
Purchase Details
Closed on
Aug 13, 2001
Sold by
Reynolds James E and Reynolds Cherilyn R
Bought by
Her Nao and Vang Khou
Home Financials for this Owner
Home Financials are based on the most recent Mortgage that was taken out on this home.
Original Mortgage
$100,105
Interest Rate
7.05%
Mortgage Type
FHA
Purchase Details
Closed on
May 6, 1994
Sold by
Hunter Rick E and Reynolds Cherilyn R
Bought by
Reynolds James E and Reynolds Cherilyn R
Home Financials for this Owner
Home Financials are based on the most recent Mortgage that was taken out on this home.
Original Mortgage
$66,000
Interest Rate
8.1%
Purchase Details
Closed on
Apr 21, 1994
Sold by
Va
Bought by
Hunter Rick E and Hunter Cherilyn R
Home Financials for this Owner
Home Financials are based on the most recent Mortgage that was taken out on this home.
Original Mortgage
$66,000
Interest Rate
8.1%
Create a Home Valuation Report for This Property
The Home Valuation Report is an in-depth analysis detailing your home's value as well as a comparison with similar homes in the area
Home Values in the Area
Average Home Value in this Area
Purchase History
| Date | Buyer | Sale Price | Title Company |
|---|---|---|---|
| Pacific Regional Properties L P | -- | First American Title Company | |
| Pacific Regional Properties Lp | $98,000 | Chicago Title Company | |
| Deutsche Bank National Trust Co | $116,000 | None Available | |
| Flores Adriana | $300,000 | First American Title Ins Co | |
| Flores Adriana | -- | First American Title Ins Co | |
| Saucedo Jose | $173,000 | Financial Title Company | |
| Her Nao | $101,000 | Financial Title Company | |
| Reynolds James E | -- | Commonwealth Land Title Ins | |
| Hunter Rick E | -- | Commonwealth Land Title |
Source: Public Records
Mortgage History
| Date | Status | Borrower | Loan Amount |
|---|---|---|---|
| Previous Owner | Pacific Regional Properties L P | $2,750,000 | |
| Previous Owner | Flores Adriana | $57,000 | |
| Previous Owner | Flores Adriana | $228,000 | |
| Previous Owner | Saucedo Jose | $138,400 | |
| Previous Owner | Her Nao | $100,105 | |
| Previous Owner | Reynolds James E | $66,000 | |
| Closed | Saucedo Jose | $34,600 |
Source: Public Records
Tax History Compared to Growth
Tax History
| Year | Tax Paid | Tax Assessment Tax Assessment Total Assessment is a certain percentage of the fair market value that is determined by local assessors to be the total taxable value of land and additions on the property. | Land | Improvement |
|---|---|---|---|---|
| 2025 | $1,588 | $126,190 | $57,943 | $68,247 |
| 2023 | $1,557 | $121,292 | $55,694 | $65,598 |
| 2022 | $1,536 | $118,914 | $54,602 | $64,312 |
| 2021 | $1,494 | $116,583 | $53,532 | $63,051 |
| 2020 | $1,488 | $115,389 | $52,984 | $62,405 |
| 2019 | $1,431 | $113,128 | $51,946 | $61,182 |
| 2018 | $1,401 | $110,911 | $50,928 | $59,983 |
| 2017 | $1,377 | $108,737 | $49,930 | $58,807 |
| 2016 | $1,332 | $106,605 | $48,951 | $57,654 |
| 2015 | $1,311 | $105,004 | $48,216 | $56,788 |
| 2014 | $1,287 | $102,948 | $47,272 | $55,676 |
Source: Public Records
Map
Nearby Homes
- 2441 N Chestnut Ave
- 4747 E Clinton Ave
- 1745 N Winery Ave Unit multi
- 1745 N Winery Ave Unit 102
- 4875 E Mckinley Ave Unit 129
- 4787 E Cornell Ave
- 4843 E Oslin Ave
- 4819 E Home Ave
- 4791 E Simpson Ave
- 4674 E Princeton Ave
- 4641 E Weldon Ave
- 4942 E Oslin Ave
- 4808 E Pine Ave
- 2243 E Cambridge Ave
- 4704 E Simpson Ave
- 1431 N Willow Ave
- 5060 E Weathermaker Ave
- 4597 E Cambridge Ave
- 4625 E Princeton Ave
- 6523 E Sooner Dr
- 2214 N Laureen Ave
- 2232 N Laureen Ave
- 4882 E Vassar Ave
- 2208 N Laureen Ave
- 4884 E Vassar Ave
- 2223 N Laureen Ave
- 2140 N Laureen Ave
- 2215 N Laureen Ave
- 2231 N Laureen Ave
- 2209 N Laureen Ave
- 2239 N Laureen Ave
- 4892 E Vassar Ave
- 2132 N Laureen Ave
- 4883 E Vassar Ave
- 2139 N Laureen Ave
- 4881 E Vassar Ave
- 2215 N Winery Ave Unit 2121-F
- 4877 E Vassar Ave
- 4873 E Vassar Ave
- 2243 N Laureen Ave