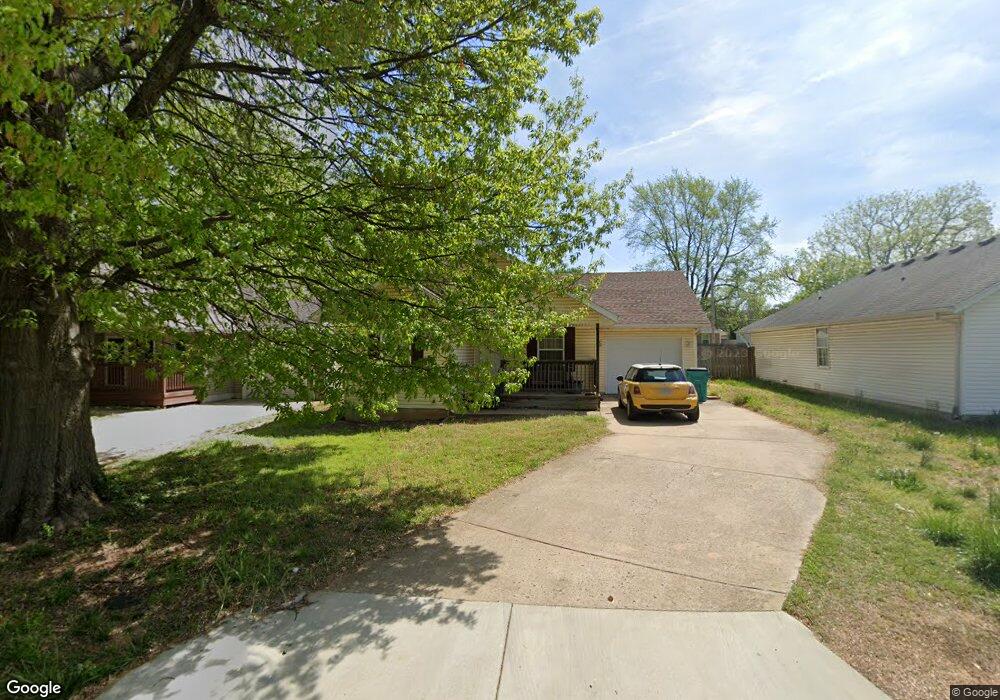
2222 N Oakland Ave Springfield, MO 65803
Tom Watkins NeighborhoodEstimated Value: $159,913 - $211,000
3
Beds
2
Baths
1,152
Sq Ft
$156/Sq Ft
Est. Value
About This Home
This home is located at 2222 N Oakland Ave, Springfield, MO 65803 and is currently estimated at $179,978, approximately $156 per square foot. 2222 N Oakland Ave is a home located in Greene County with nearby schools including Williams Elementary School, Reed Academy, and Hillcrest High School.
Ownership History
Date
Name
Owned For
Owner Type
Purchase Details
Closed on
Nov 20, 2023
Sold by
Kensinger Teresa
Bought by
Kensinger Jacob A
Current Estimated Value
Home Financials for this Owner
Home Financials are based on the most recent Mortgage that was taken out on this home.
Original Mortgage
$78,551
Outstanding Balance
$76,663
Interest Rate
6.75%
Mortgage Type
FHA
Estimated Equity
$103,315
Purchase Details
Closed on
Oct 12, 2006
Sold by
Foster Larry D and Foster Margaret A
Bought by
Kensinger Teresa
Home Financials for this Owner
Home Financials are based on the most recent Mortgage that was taken out on this home.
Original Mortgage
$63,800
Interest Rate
8.87%
Mortgage Type
Adjustable Rate Mortgage/ARM
Purchase Details
Closed on
Nov 18, 2005
Sold by
Horton Vickie
Bought by
Foster Larry D and Foster Margaret A
Create a Home Valuation Report for This Property
The Home Valuation Report is an in-depth analysis detailing your home's value as well as a comparison with similar homes in the area
Home Values in the Area
Average Home Value in this Area
Purchase History
| Date | Buyer | Sale Price | Title Company |
|---|---|---|---|
| Kensinger Jacob A | -- | None Listed On Document | |
| Kensinger Teresa | -- | None Available | |
| Foster Larry D | -- | Fidelity Title Agency 417-88 |
Source: Public Records
Mortgage History
| Date | Status | Borrower | Loan Amount |
|---|---|---|---|
| Open | Kensinger Jacob A | $78,551 | |
| Closed | Kensinger Jacob A | $3,142 | |
| Previous Owner | Kensinger Teresa | $63,800 |
Source: Public Records
Tax History
| Year | Tax Paid | Tax Assessment Tax Assessment Total Assessment is a certain percentage of the fair market value that is determined by local assessors to be the total taxable value of land and additions on the property. | Land | Improvement |
|---|---|---|---|---|
| 2025 | $1,100 | $22,080 | $2,850 | $19,230 |
| 2024 | $1,048 | $19,530 | $1,900 | $17,630 |
| 2023 | $1,042 | $19,530 | $1,900 | $17,630 |
| 2022 | $929 | $17,020 | $1,900 | $15,120 |
| 2021 | $929 | $17,020 | $1,900 | $15,120 |
| 2020 | $891 | $15,600 | $1,900 | $13,700 |
| 2019 | $866 | $15,600 | $1,900 | $13,700 |
| 2018 | $885 | $15,960 | $1,900 | $14,060 |
| 2017 | $876 | $15,960 | $1,900 | $14,060 |
| 2016 | $875 | $15,960 | $1,900 | $14,060 |
| 2015 | $867 | $15,960 | $1,900 | $14,060 |
| 2014 | $873 | $15,960 | $1,900 | $14,060 |
Source: Public Records
Map
Nearby Homes
- 2234 N Fay Ave
- 2253 N Fay Ave
- 2130 N Elizabeth Ave
- 2306 N Fay Ave
- 2117 N Lexington Ave
- 2111 N Elizabeth Ave
- 2105 N Elizabeth Ave
- 2327 N Lexington Ave
- 2119 N Marion Ave
- 1.21 Acres N Kansas Expy
- 2326 N Farmer Ave
- 2250 N Kansas Kxpy Expy
- 2237 N Park Ave
- 2130 N Park Ave
- 1634 W Lee St
- 2453 N Albertha Ave
- 1956 W Atlantic St
- 1700 W Atlantic St
- 1516 W Lee St
- Lot 1 N Grace Ave
- 2226 N Oakland Ave
- 2218 N Oakland Ave
- 2232 N Oakland Ave
- 2216 N Oakland Ave
- 2217 N Fay Ave
- 2227 N Fay Ave
- 1847 W High St
- 1857 W High St
- 2221 N Fay Ave
- 2233 N Fay Ave
- 2226 N Elizabeth Ave
- 1843 W High St
- 2242 N Oakland Ave
- 1839 W High St
- 2204 N Elizabeth Ave
- 2245 N Fay Ave
- 1825 W High St
- 2212 N Fay Ave
- 2214 N Fay Ave
- 2258 N Oakland Ave
Your Personal Tour Guide
Ask me questions while you tour the home.