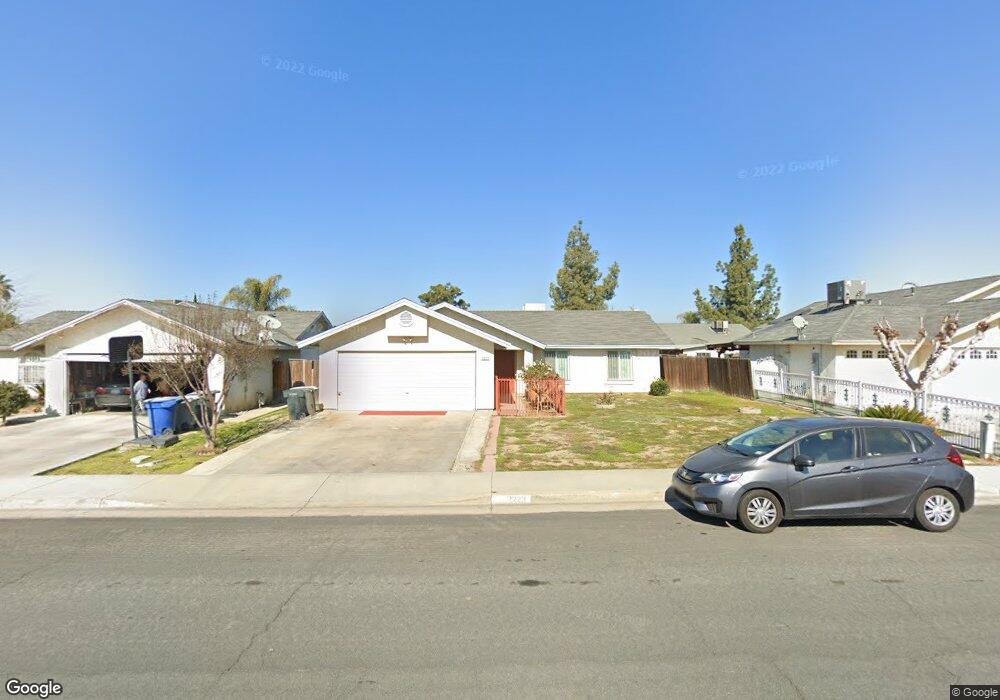
2223 17th Place Delano, CA 93215
East Delano NeighborhoodEstimated Value: $298,000 - $335,000
3
Beds
2
Baths
1,100
Sq Ft
$280/Sq Ft
Est. Value
About This Home
This home is located at 2223 17th Place, Delano, CA 93215 and is currently estimated at $307,552, approximately $279 per square foot. 2223 17th Place is a home located in Kern County with nearby schools including Harvest Elementary School, La Vina Middle School, and Delano High School.
Ownership History
Date
Name
Owned For
Owner Type
Purchase Details
Closed on
Sep 17, 1997
Sold by
Lopez Olivia A and Lopez Susan M
Bought by
Longaker Fredrick Charles and Longaker Eva Luz
Current Estimated Value
Home Financials for this Owner
Home Financials are based on the most recent Mortgage that was taken out on this home.
Original Mortgage
$73,875
Outstanding Balance
$11,469
Interest Rate
7.49%
Mortgage Type
FHA
Estimated Equity
$296,083
Create a Home Valuation Report for This Property
The Home Valuation Report is an in-depth analysis detailing your home's value as well as a comparison with similar homes in the area
Home Values in the Area
Average Home Value in this Area
Purchase History
| Date | Buyer | Sale Price | Title Company |
|---|---|---|---|
| Longaker Fredrick Charles | $74,000 | First American Title Ins Co |
Source: Public Records
Mortgage History
| Date | Status | Borrower | Loan Amount |
|---|---|---|---|
| Open | Longaker Fredrick Charles | $73,875 |
Source: Public Records
Tax History Compared to Growth
Tax History
| Year | Tax Paid | Tax Assessment Tax Assessment Total Assessment is a certain percentage of the fair market value that is determined by local assessors to be the total taxable value of land and additions on the property. | Land | Improvement |
|---|---|---|---|---|
| 2025 | $1,506 | $117,969 | $31,921 | $86,048 |
| 2024 | $1,463 | $115,657 | $31,296 | $84,361 |
| 2023 | $1,463 | $113,390 | $30,683 | $82,707 |
| 2022 | $1,438 | $111,168 | $30,082 | $81,086 |
| 2021 | $1,370 | $108,990 | $29,493 | $79,497 |
| 2020 | $1,370 | $107,873 | $29,191 | $78,682 |
| 2019 | $1,341 | $107,873 | $29,191 | $78,682 |
| 2018 | $1,324 | $103,686 | $28,058 | $75,628 |
| 2017 | $1,333 | $101,654 | $27,508 | $74,146 |
| 2016 | $1,312 | $99,662 | $26,969 | $72,693 |
| 2015 | $1,355 | $98,166 | $26,564 | $71,602 |
| 2014 | $1,268 | $96,244 | $26,044 | $70,200 |
Source: Public Records
Map
Nearby Homes