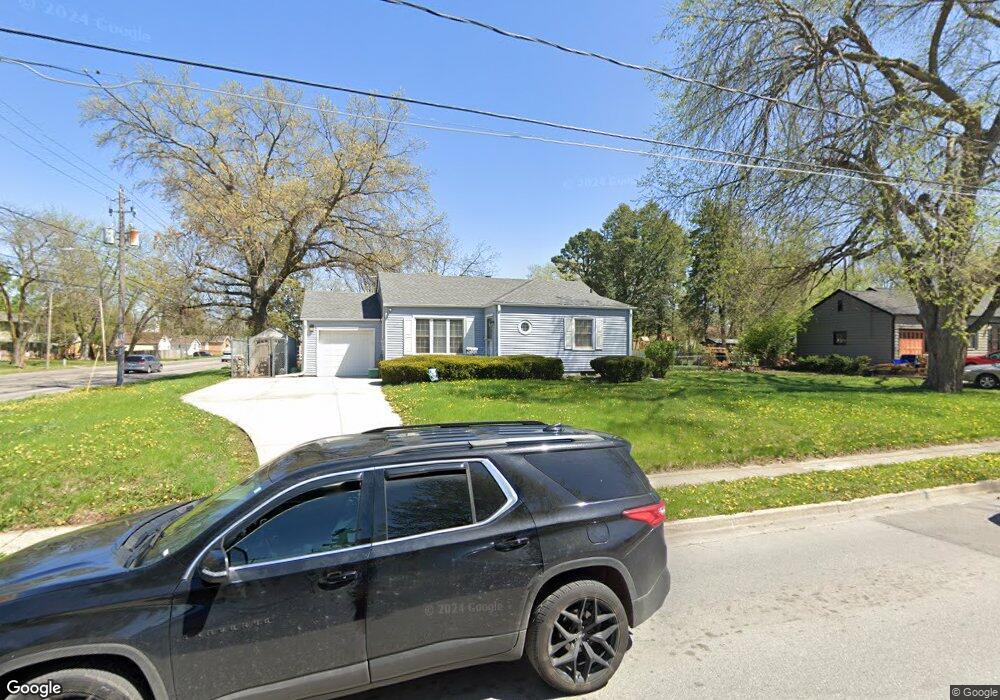
2223 55th St Des Moines, IA 50310
Merle Hay NeighborhoodEstimated Value: $213,000 - $224,000
2
Beds
2
Baths
945
Sq Ft
$233/Sq Ft
Est. Value
About This Home
This home is located at 2223 55th St, Des Moines, IA 50310 and is currently estimated at $220,240, approximately $233 per square foot. 2223 55th St is a home located in Polk County with nearby schools including Hillis Elementary School, Merrill Middle School, and Roosevelt High School.
Ownership History
Date
Name
Owned For
Owner Type
Purchase Details
Closed on
Nov 19, 2015
Sold by
Cleghorn Travis Daniel
Bought by
Hill Tiffany Paige and Cleghorn Tiffany Paige
Current Estimated Value
Purchase Details
Closed on
Mar 28, 2005
Sold by
Polk Susan L
Bought by
Cleghorn Travis D and Cleghorn Tiffany P
Home Financials for this Owner
Home Financials are based on the most recent Mortgage that was taken out on this home.
Original Mortgage
$123,630
Interest Rate
7.55%
Purchase Details
Closed on
Oct 8, 1999
Sold by
Enga Jeffrey Alan and Enga Julie A
Bought by
Polk Susan L
Home Financials for this Owner
Home Financials are based on the most recent Mortgage that was taken out on this home.
Original Mortgage
$86,350
Interest Rate
7.9%
Create a Home Valuation Report for This Property
The Home Valuation Report is an in-depth analysis detailing your home's value as well as a comparison with similar homes in the area
Home Values in the Area
Average Home Value in this Area
Purchase History
| Date | Buyer | Sale Price | Title Company |
|---|---|---|---|
| Hill Tiffany Paige | -- | None Available | |
| Cleghorn Travis D | $123,500 | -- | |
| Polk Susan L | $90,500 | -- |
Source: Public Records
Mortgage History
| Date | Status | Borrower | Loan Amount |
|---|---|---|---|
| Previous Owner | Cleghorn Travis D | $123,630 | |
| Previous Owner | Polk Susan L | $86,350 |
Source: Public Records
Tax History Compared to Growth
Tax History
| Year | Tax Paid | Tax Assessment Tax Assessment Total Assessment is a certain percentage of the fair market value that is determined by local assessors to be the total taxable value of land and additions on the property. | Land | Improvement |
|---|---|---|---|---|
| 2025 | $3,462 | $204,400 | $62,000 | $142,400 |
| 2024 | $3,462 | $186,400 | $55,700 | $130,700 |
| 2023 | $3,436 | $186,400 | $55,700 | $130,700 |
| 2022 | $3,408 | $154,700 | $47,500 | $107,200 |
| 2021 | $3,214 | $154,700 | $47,500 | $107,200 |
| 2020 | $3,334 | $137,400 | $41,900 | $95,500 |
| 2019 | $3,154 | $137,400 | $41,900 | $95,500 |
| 2018 | $3,118 | $125,900 | $37,800 | $88,100 |
| 2017 | $2,906 | $125,900 | $37,800 | $88,100 |
| 2016 | $2,828 | $116,000 | $34,300 | $81,700 |
| 2015 | $2,828 | $116,000 | $34,300 | $81,700 |
| 2014 | $2,630 | $107,700 | $31,700 | $76,000 |
Source: Public Records
Map
Nearby Homes