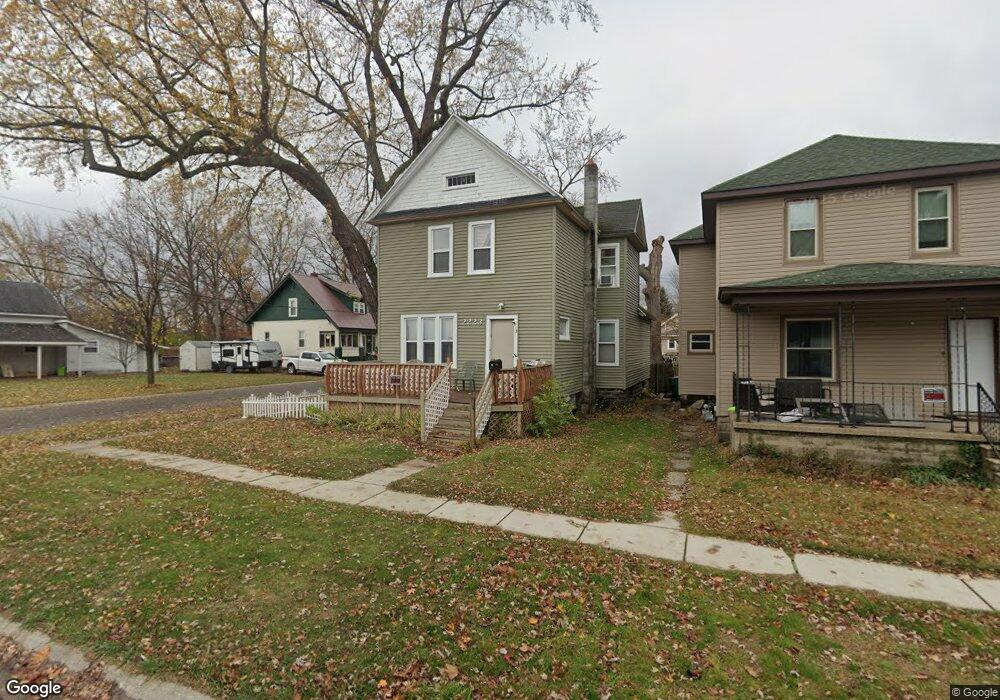
2223 7th St Port Huron, MI 48060
Estimated Value: $125,000 - $160,000
3
Beds
2
Baths
1,610
Sq Ft
$90/Sq Ft
Est. Value
About This Home
This home is located at 2223 7th St, Port Huron, MI 48060 and is currently estimated at $144,697, approximately $89 per square foot. 2223 7th St is a home located in St. Clair County with nearby schools including Woodrow Wilson Elementary School, Central Middle School, and Port Huron High School.
Ownership History
Date
Name
Owned For
Owner Type
Purchase Details
Closed on
Mar 25, 2010
Sold by
Jpmorgan Chase Bank National Association
Bought by
Federal National Mortgage Association
Current Estimated Value
Purchase Details
Closed on
Mar 18, 2010
Sold by
Marsh Andrew J and Marsh Joann M
Bought by
Jpmorgan Chase Bank National Association
Purchase Details
Closed on
Dec 12, 2005
Sold by
Marsh Andrew J and Marsh Joann M
Bought by
A & J Marsh Investments Llc
Create a Home Valuation Report for This Property
The Home Valuation Report is an in-depth analysis detailing your home's value as well as a comparison with similar homes in the area
Home Values in the Area
Average Home Value in this Area
Purchase History
| Date | Buyer | Sale Price | Title Company |
|---|---|---|---|
| Federal National Mortgage Association | -- | None Available | |
| Jpmorgan Chase Bank National Association | $91,936 | None Available | |
| A & J Marsh Investments Llc | -- | None Available |
Source: Public Records
Tax History Compared to Growth
Tax History
| Year | Tax Paid | Tax Assessment Tax Assessment Total Assessment is a certain percentage of the fair market value that is determined by local assessors to be the total taxable value of land and additions on the property. | Land | Improvement |
|---|---|---|---|---|
| 2025 | $1,914 | $60,300 | $0 | $0 |
| 2024 | $1,657 | $57,100 | $0 | $0 |
| 2023 | $1,569 | $50,400 | $0 | $0 |
| 2022 | $1,550 | $42,300 | $0 | $0 |
| 2021 | $1,497 | $36,800 | $0 | $0 |
| 2020 | $1,486 | $32,300 | $32,300 | $0 |
| 2019 | $1,593 | $22,900 | $0 | $0 |
| 2018 | $1,427 | $22,900 | $0 | $0 |
| 2017 | $1,310 | $21,600 | $0 | $0 |
| 2016 | $1,161 | $21,600 | $0 | $0 |
| 2015 | $996 | $21,500 | $21,500 | $0 |
| 2014 | $996 | $22,200 | $22,200 | $0 |
| 2013 | -- | $24,400 | $0 | $0 |
Source: Public Records
Map
Nearby Homes
- 730 Jenkinson St
- 2109 Military St
- 738 Bancroft St
- 823 Beard St
- 731 Bancroft St
- 831 Bancroft St
- 2444 Military St
- 1712 7th St
- 1623 8th St
- 620 Griswold St
- 1112 Minnie St
- 1831 11th St
- 926 Griswold St
- 1127 Minnie St
- 000 10th St
- 2718 Electric Ave
- 1132 Griswold St
- 2704 Military St
- 1309 Division St
- 1403 Catherine McAuley Dr