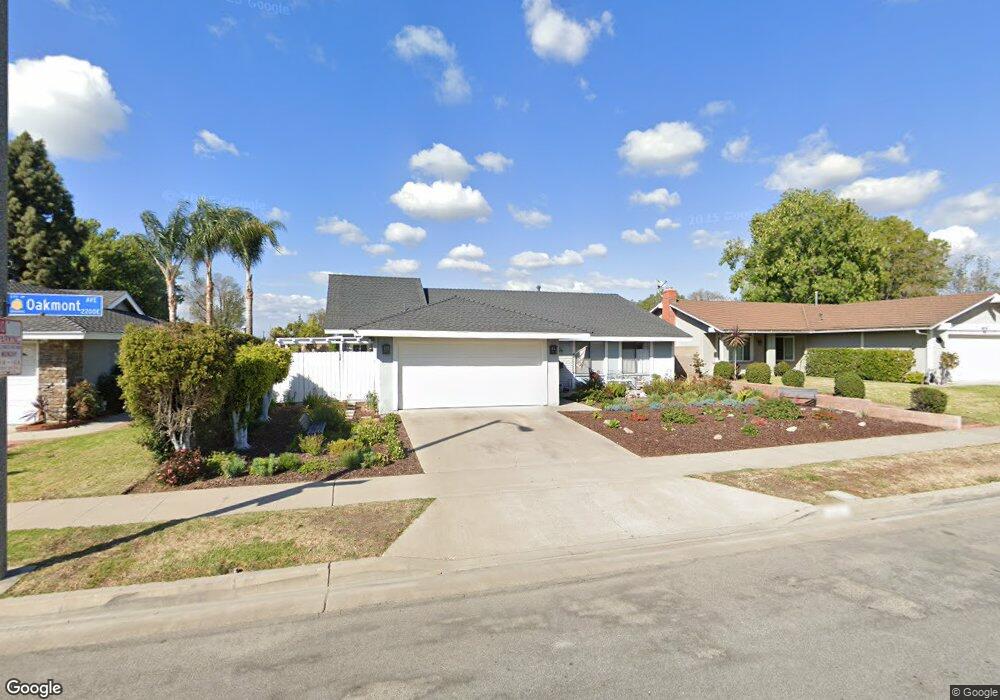
2223 E Oakmont Ave Orange, CA 92867
Estimated Value: $1,092,119 - $1,400,000
3
Beds
2
Baths
2,216
Sq Ft
$570/Sq Ft
Est. Value
About This Home
This home is located at 2223 E Oakmont Ave, Orange, CA 92867 and is currently estimated at $1,263,280, approximately $570 per square foot. 2223 E Oakmont Ave is a home located in Orange County with nearby schools including Handy Elementary School, Yorba Middle School, and Orange High School.
Ownership History
Date
Name
Owned For
Owner Type
Purchase Details
Closed on
Mar 20, 1997
Sold by
Barnhart Janet M
Bought by
Barnhart Janet M
Current Estimated Value
Home Financials for this Owner
Home Financials are based on the most recent Mortgage that was taken out on this home.
Original Mortgage
$144,800
Interest Rate
7.63%
Create a Home Valuation Report for This Property
The Home Valuation Report is an in-depth analysis detailing your home's value as well as a comparison with similar homes in the area
Home Values in the Area
Average Home Value in this Area
Purchase History
| Date | Buyer | Sale Price | Title Company |
|---|---|---|---|
| Barnhart Janet M | -- | Gateway Title |
Source: Public Records
Mortgage History
| Date | Status | Borrower | Loan Amount |
|---|---|---|---|
| Closed | Barnhart Janet M | $144,800 |
Source: Public Records
Tax History
| Year | Tax Paid | Tax Assessment Tax Assessment Total Assessment is a certain percentage of the fair market value that is determined by local assessors to be the total taxable value of land and additions on the property. | Land | Improvement |
|---|---|---|---|---|
| 2025 | $4,204 | $374,879 | $231,676 | $143,203 |
| 2024 | $4,204 | $367,529 | $227,133 | $140,396 |
| 2023 | $4,108 | $360,323 | $222,679 | $137,644 |
| 2022 | $4,025 | $353,258 | $218,312 | $134,946 |
| 2021 | $3,914 | $346,332 | $214,032 | $132,300 |
| 2020 | $3,877 | $342,781 | $211,837 | $130,944 |
| 2019 | $3,829 | $336,060 | $207,683 | $128,377 |
| 2018 | $3,770 | $329,471 | $203,611 | $125,860 |
| 2017 | $3,616 | $323,011 | $199,618 | $123,393 |
| 2016 | $3,546 | $316,678 | $195,704 | $120,974 |
| 2015 | $3,493 | $311,922 | $192,765 | $119,157 |
| 2014 | $3,418 | $305,812 | $188,989 | $116,823 |
Source: Public Records
Map
Nearby Homes
- 1920 E Barkley Ave
- 1801 E Collins Ave Unit 36
- 773 N Elmwood St
- 2705 E Orange Grove Ave
- 2331 E Adams Ave
- 1166 N Handy St
- 2929 E Hamilton Ave
- 2710 E Adams Ave
- 1409 E Orange Grove Ave
- 692 N Adele St Unit 50
- 692 N Adele St Unit 30
- 692 N Adele St Unit 78
- 2720 E Walnut Ave Unit 73
- 1163 N Hart St
- 605 N Pageant Dr Unit B
- 1514 E Palm Ave
- 1420 N Sacramento St
- 365 N Magnolia St
- 934 E Rose Ave
- 18062 Rosanne Cir
- 2233 E Oakmont Ave
- 2211 E Oakmont Ave
- 2245 E Oakmont Ave
- 2225 E Mayfair Ave
- 770 N Markwood St
- 2231 E Mayfair Ave
- 2301 E Oakmont Ave
- 760 N Markwood St
- 2309 E Oakmont Ave
- 772 N Milford St
- 2239 E Mayfair Ave
- 750 N Markwood St
- 762 N Milford St
- 2319 E Oakmont Ave
- 2226 E Mayfair Ave
- 2238 E Mayfair Ave
- 752 N Milford St
- 740 N Markwood St
- 2329 E Oakmont Ave
- 742 N Milford St
Your Personal Tour Guide
Ask me questions while you tour the home.