2223 Kings View Cir Unit 109 Spring Valley, CA 91977
Estimated Value: $523,000 - $561,000
2
Beds
3
Baths
1,020
Sq Ft
$535/Sq Ft
Est. Value
About This Home
This home is located at 2223 Kings View Cir Unit 109, Spring Valley, CA 91977 and is currently estimated at $545,641, approximately $534 per square foot. 2223 Kings View Cir Unit 109 is a home located in San Diego County with nearby schools including Bancroft Elementary School, Science, Technology, Engineering, Arts, And Math Academy, and Monte Vista High School.
Ownership History
Date
Name
Owned For
Owner Type
Purchase Details
Closed on
Oct 28, 2016
Sold by
Nichols David E
Bought by
Carney Megan
Current Estimated Value
Home Financials for this Owner
Home Financials are based on the most recent Mortgage that was taken out on this home.
Original Mortgage
$200,000
Outstanding Balance
$160,565
Interest Rate
3.42%
Mortgage Type
New Conventional
Estimated Equity
$385,076
Purchase Details
Closed on
Jun 9, 2005
Sold by
Nichols David E and Nichols Jackie L
Bought by
Nichols David E
Purchase Details
Closed on
Dec 29, 1993
Sold by
Radnor Sunland Spring Valley Partnership
Bought by
Nichols David E
Home Financials for this Owner
Home Financials are based on the most recent Mortgage that was taken out on this home.
Original Mortgage
$99,900
Interest Rate
6.59%
Mortgage Type
FHA
Create a Home Valuation Report for This Property
The Home Valuation Report is an in-depth analysis detailing your home's value as well as a comparison with similar homes in the area
Home Values in the Area
Average Home Value in this Area
Purchase History
| Date | Buyer | Sale Price | Title Company |
|---|---|---|---|
| Carney Megan | $283,000 | Fidelity Title Sd | |
| Nichols David E | -- | -- | |
| Nichols David E | $103,000 | First American Title |
Source: Public Records
Mortgage History
| Date | Status | Borrower | Loan Amount |
|---|---|---|---|
| Open | Carney Megan | $200,000 | |
| Previous Owner | Nichols David E | $99,900 |
Source: Public Records
Tax History Compared to Growth
Tax History
| Year | Tax Paid | Tax Assessment Tax Assessment Total Assessment is a certain percentage of the fair market value that is determined by local assessors to be the total taxable value of land and additions on the property. | Land | Improvement |
|---|---|---|---|---|
| 2025 | $4,338 | $328,438 | $124,480 | $203,958 |
| 2024 | $4,338 | $321,999 | $122,040 | $199,959 |
| 2023 | $4,199 | $315,687 | $119,648 | $196,039 |
| 2022 | $4,126 | $309,498 | $117,302 | $192,196 |
| 2021 | $4,086 | $303,430 | $115,002 | $188,428 |
| 2020 | $3,920 | $300,319 | $113,823 | $186,496 |
| 2019 | $3,860 | $294,432 | $111,592 | $182,840 |
| 2018 | $3,740 | $288,659 | $109,404 | $179,255 |
| 2017 | $3,646 | $283,000 | $107,259 | $175,741 |
| 2016 | $2,099 | $147,726 | $55,989 | $91,737 |
| 2015 | $2,081 | $145,508 | $55,148 | $90,360 |
| 2014 | $2,048 | $142,658 | $54,068 | $88,590 |
Source: Public Records
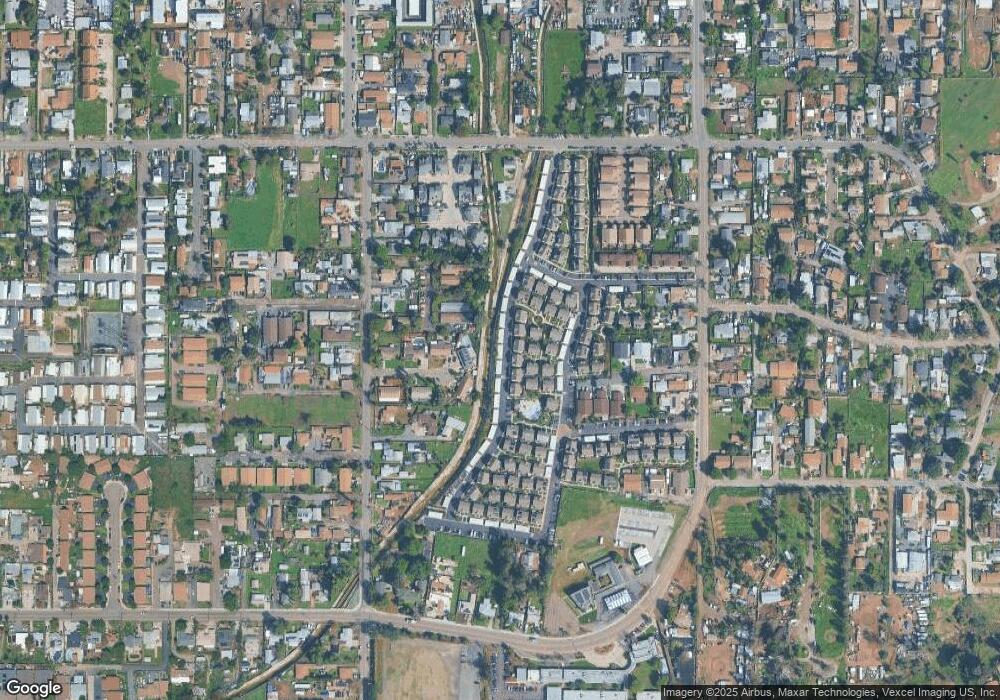
Map
Nearby Homes
- 2256 Kings View Cir
- 8920 King Michael Ct
- 2515 Sweetwater Rd Unit 42
- 2515 Sweetwater Rd Unit SPC 23
- 2515 Sweetwater Rd Unit 63
- 9077 Avocado St
- 9188 Valencia St
- 8837 Ildica St
- 8932 Troy St
- 8975 Lamar St
- 3101 King Arthurs Ct
- 9180 Tokaj Ln
- 2018 Barite St
- 2000 Crofton St Unit SPC 39
- 8539 Vista Azul
- 8540 Vista Azul
- 8532 Vista Azul
- 8564 Vista Azul
- 2305 Highview Ln
- 3221 Bancroft Dr Unit 24
- 2479 Kings View Cir
- 2153 Kings View Cir
- 2219 Kings View Cir
- 2211 Kings View Cir
- 2207 Kings View Cir
- 2169 Kings View Cir
- 2177 Kings View Cir Unit 100
- 2149 Kings View Cir
- 2235 Kings View Cir
- 2231 Kings View Cir Unit 116
- 2227 Kings View Cir
- 2533 Kings View Cir
- 2473 Kings View Cir
- 2239 Kings View Cir
- 2425 Central Ave
- 8865 Cory Ct
- 2161 Kings View Cir Unit 95
- 2157 Kings View Cir
- 2521 Kings View Cir
- 2527 Kings View Cir