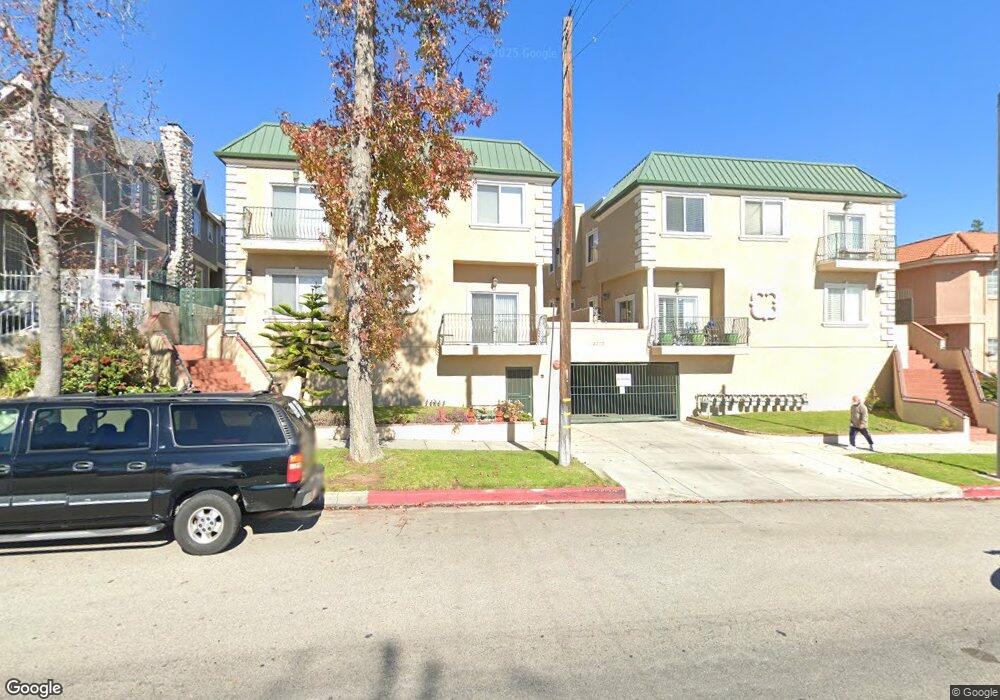
2223 Montrose Ave Unit 3 Montrose, CA 91020
Montecito Park NeighborhoodEstimated Value: $899,000 - $1,041,000
3
Beds
3
Baths
1,730
Sq Ft
$548/Sq Ft
Est. Value
About This Home
This home is located at 2223 Montrose Ave Unit 3, Montrose, CA 91020 and is currently estimated at $948,902, approximately $548 per square foot. 2223 Montrose Ave Unit 3 is a home located in Los Angeles County with nearby schools including John C. Fremont Elementary School, Rosemont Middle School, and Crescenta Valley High School.
Ownership History
Date
Name
Owned For
Owner Type
Purchase Details
Closed on
Jan 13, 2010
Sold by
Jang Soon Ho
Bought by
Lee Kang Sung
Current Estimated Value
Purchase Details
Closed on
May 23, 2006
Sold by
Hong Ernesto Francisco
Bought by
Jang Soon Ho
Home Financials for this Owner
Home Financials are based on the most recent Mortgage that was taken out on this home.
Original Mortgage
$64,500
Interest Rate
6.56%
Mortgage Type
Stand Alone Second
Purchase Details
Closed on
Feb 19, 2004
Sold by
Song Yu Chin
Bought by
Hong Ernesto Francisco
Home Financials for this Owner
Home Financials are based on the most recent Mortgage that was taken out on this home.
Original Mortgage
$351,750
Interest Rate
4.75%
Mortgage Type
Purchase Money Mortgage
Purchase Details
Closed on
Feb 21, 2002
Sold by
Celine Terrace Llc
Bought by
Song Yu Chin
Home Financials for this Owner
Home Financials are based on the most recent Mortgage that was taken out on this home.
Original Mortgage
$319,500
Interest Rate
6.85%
Create a Home Valuation Report for This Property
The Home Valuation Report is an in-depth analysis detailing your home's value as well as a comparison with similar homes in the area
Home Values in the Area
Average Home Value in this Area
Purchase History
| Date | Buyer | Sale Price | Title Company |
|---|---|---|---|
| Lee Kang Sung | $440,000 | Lawyers Title | |
| Jang Soon Ho | $645,000 | Lawyers Title Company | |
| Hong Ernesto Francisco | $469,000 | Chicago Title Co | |
| Song Yu Chin | $355,000 | Investors Title Company |
Source: Public Records
Mortgage History
| Date | Status | Borrower | Loan Amount |
|---|---|---|---|
| Previous Owner | Jang Soon Ho | $64,500 | |
| Previous Owner | Jang Soon Ho | $516,000 | |
| Previous Owner | Hong Ernesto Francisco | $351,750 | |
| Previous Owner | Song Yu Chin | $319,500 |
Source: Public Records
Tax History Compared to Growth
Tax History
| Year | Tax Paid | Tax Assessment Tax Assessment Total Assessment is a certain percentage of the fair market value that is determined by local assessors to be the total taxable value of land and additions on the property. | Land | Improvement |
|---|---|---|---|---|
| 2025 | $6,457 | $567,946 | $297,010 | $270,936 |
| 2024 | $6,457 | $556,811 | $291,187 | $265,624 |
| 2023 | $6,314 | $545,894 | $285,478 | $260,416 |
| 2022 | $6,107 | $535,191 | $279,881 | $255,310 |
| 2021 | $5,998 | $524,698 | $274,394 | $250,304 |
| 2019 | $5,770 | $509,137 | $266,256 | $242,881 |
| 2018 | $5,673 | $499,155 | $261,036 | $238,119 |
| 2016 | $5,406 | $479,773 | $250,900 | $228,873 |
| 2015 | $5,288 | $472,568 | $247,132 | $225,436 |
| 2014 | $5,245 | $463,313 | $242,292 | $221,021 |
Source: Public Records
Map
Nearby Homes
- 2222 Montrose Ave Unit G
- 2249 Montrose Ave Unit 7
- 4430 Rosebank Dr
- 2102 La Canada Crest Dr Unit B
- 2468 Montrose Ave Unit 6
- 3658 Sierra Vista Ave
- 2048 Valderas Dr
- 3470 Downing Ave
- 4326 Briggs Ave
- 3508 Rosemary Ave
- 2522 Fairway Ave
- 2434 Prospect Ave
- 4328 Sunset Ave
- 3328 N Verdugo Rd
- 2512 Prospect Ave
- 2710 Piedmont Ave Unit 21
- 4639 El Camino Corto
- 4644 Hillard Ave
- 4467 Ardara Place
- 1929 Lyans Dr
- 2223 Montrose Ave Unit 4
- 2223 Montrose Ave Unit 1
- 2223 Montrose Ave Unit 12
- 2223 Montrose Ave Unit 11
- 2223 Montrose Ave Unit 10
- 2223 Montrose Ave Unit 9
- 2223 Montrose Ave Unit 8
- 2223 Montrose Ave Unit 7
- 2223 Montrose Ave Unit 6
- 2223 Montrose Ave Unit 5
- 2223 Montrose Ave Unit 2
- 2231 Montrose Ave Unit 13
- 2231 Montrose Ave Unit 12
- 2231 Montrose Ave Unit 11
- 2231 Montrose Ave Unit 10
- 2231 Montrose Ave Unit 9
- 2231 Montrose Ave Unit 7
- 2231 Montrose Ave Unit 6
- 2231 Montrose Ave Unit 5
- 2231 Montrose Ave Unit 4