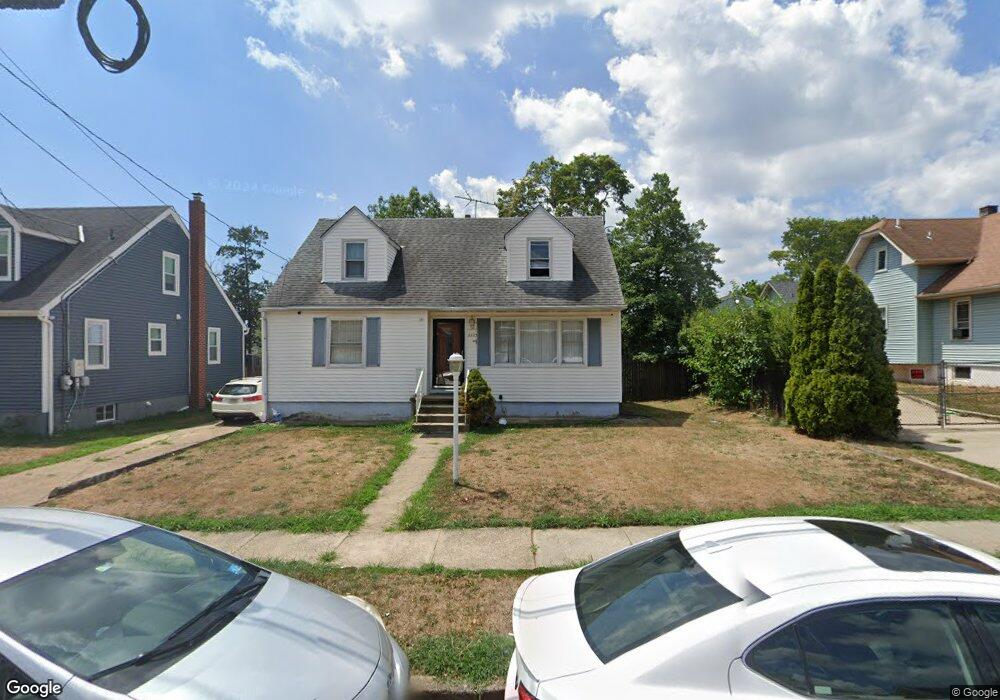
2223 Penn St Pennsauken, NJ 08110
Estimated Value: $225,765 - $371,000
--
Bed
--
Bath
1,529
Sq Ft
$202/Sq Ft
Est. Value
About This Home
This home is located at 2223 Penn St, Pennsauken, NJ 08110 and is currently estimated at $309,441, approximately $202 per square foot. 2223 Penn St is a home located in Camden County with nearby schools including Pennsauken High School, St. Peter Elementary School, and St. Cecilia School.
Ownership History
Date
Name
Owned For
Owner Type
Purchase Details
Closed on
May 9, 2012
Sold by
Nguyen Cuc
Bought by
Nguyen Dong
Current Estimated Value
Purchase Details
Closed on
Dec 9, 1999
Sold by
Frey Jacqueline L
Bought by
Nguyen Cuc
Purchase Details
Closed on
Nov 30, 1998
Sold by
Fuller Rodedrick E
Bought by
Kendorski Vincent and Frey Jacqueline L
Home Financials for this Owner
Home Financials are based on the most recent Mortgage that was taken out on this home.
Original Mortgage
$90,235
Interest Rate
6.68%
Mortgage Type
FHA
Create a Home Valuation Report for This Property
The Home Valuation Report is an in-depth analysis detailing your home's value as well as a comparison with similar homes in the area
Home Values in the Area
Average Home Value in this Area
Purchase History
| Date | Buyer | Sale Price | Title Company |
|---|---|---|---|
| Nguyen Dong | -- | None Available | |
| Nguyen Cuc | $79,900 | -- | |
| Kendorski Vincent | $91,000 | -- |
Source: Public Records
Mortgage History
| Date | Status | Borrower | Loan Amount |
|---|---|---|---|
| Previous Owner | Kendorski Vincent | $90,235 |
Source: Public Records
Tax History Compared to Growth
Tax History
| Year | Tax Paid | Tax Assessment Tax Assessment Total Assessment is a certain percentage of the fair market value that is determined by local assessors to be the total taxable value of land and additions on the property. | Land | Improvement |
|---|---|---|---|---|
| 2025 | $6,267 | $245,400 | $52,000 | $193,400 |
| 2024 | $6,146 | $144,000 | $42,500 | $101,500 |
| 2023 | $6,146 | $144,000 | $42,500 | $101,500 |
| 2022 | $5,557 | $144,000 | $42,500 | $101,500 |
| 2021 | $5,707 | $144,000 | $42,500 | $101,500 |
| 2020 | $5,112 | $144,000 | $42,500 | $101,500 |
| 2019 | $5,171 | $144,000 | $42,500 | $101,500 |
| 2018 | $5,198 | $144,000 | $42,500 | $101,500 |
| 2017 | $5,208 | $144,000 | $42,500 | $101,500 |
| 2016 | $5,115 | $144,000 | $42,500 | $101,500 |
| 2015 | $5,268 | $144,000 | $42,500 | $101,500 |
| 2014 | $4,972 | $89,400 | $21,000 | $68,400 |
Source: Public Records
Map
Nearby Homes
- 2117 Penn St
- 2269 Marlon Ave
- 2217 Hillcrest Ave
- 2254 Hollinshed Ave
- 6134 Grant Ave
- 2429 Norwood Ave
- 6151 Harvey Ave
- 1765 Hillcrest Ave
- 1506 Hollinshed Ave
- 2905 N Centre St
- 6902 Collins Ave
- 6116 Rogers Ave
- 5507 Wayne Ave
- 3204 Merchantville Ave
- 7028 Collins Ave
- 5745 Cedar Ave
- 2154 Browning Rd
- 1666 Browning Rd
- 116 N Centre St
- 5532 Whitman Terrace