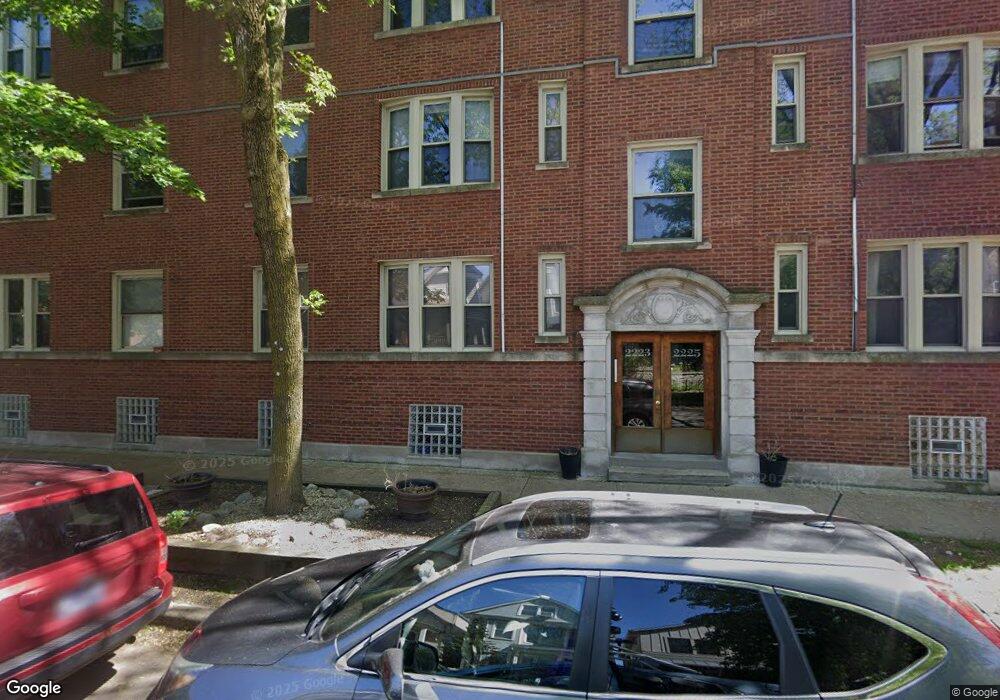
2223 W Ainslie St Unit 2 Chicago, IL 60625
Lincoln Square NeighborhoodEstimated Value: $238,000 - $278,000
1
Bed
1
Bath
775
Sq Ft
$332/Sq Ft
Est. Value
About This Home
This home is located at 2223 W Ainslie St Unit 2, Chicago, IL 60625 and is currently estimated at $257,044, approximately $331 per square foot. 2223 W Ainslie St Unit 2 is a home located in Cook County with nearby schools including McPherson Elementary School, Amundsen High School, and St. Matthias School.
Ownership History
Date
Name
Owned For
Owner Type
Purchase Details
Closed on
Feb 23, 2017
Sold by
Schuster Allison
Bought by
Gabrielcik Lisa
Current Estimated Value
Home Financials for this Owner
Home Financials are based on the most recent Mortgage that was taken out on this home.
Original Mortgage
$163,975
Outstanding Balance
$136,726
Interest Rate
4.37%
Mortgage Type
FHA
Estimated Equity
$120,318
Purchase Details
Closed on
May 21, 2013
Sold by
Ching William C and Huang Feifei
Bought by
Schuster Allison
Home Financials for this Owner
Home Financials are based on the most recent Mortgage that was taken out on this home.
Original Mortgage
$141,958
Interest Rate
3.91%
Mortgage Type
New Conventional
Purchase Details
Closed on
May 20, 2005
Sold by
Ainslie Bell Llc
Bought by
Ching William C
Home Financials for this Owner
Home Financials are based on the most recent Mortgage that was taken out on this home.
Original Mortgage
$136,410
Interest Rate
6.07%
Mortgage Type
Fannie Mae Freddie Mac
Create a Home Valuation Report for This Property
The Home Valuation Report is an in-depth analysis detailing your home's value as well as a comparison with similar homes in the area
Home Values in the Area
Average Home Value in this Area
Purchase History
| Date | Buyer | Sale Price | Title Company |
|---|---|---|---|
| Gabrielcik Lisa | $167,000 | Chicago Title | |
| Schuster Allison | $146,500 | North American Title Co | |
| Ching William C | $179,500 | Multiple |
Source: Public Records
Mortgage History
| Date | Status | Borrower | Loan Amount |
|---|---|---|---|
| Open | Gabrielcik Lisa | $163,975 | |
| Previous Owner | Schuster Allison | $4,395 | |
| Previous Owner | Schuster Allison | $141,958 | |
| Previous Owner | Ching William C | $136,410 | |
| Closed | Ching William C | $25,000 |
Source: Public Records
Tax History Compared to Growth
Tax History
| Year | Tax Paid | Tax Assessment Tax Assessment Total Assessment is a certain percentage of the fair market value that is determined by local assessors to be the total taxable value of land and additions on the property. | Land | Improvement |
|---|---|---|---|---|
| 2024 | $3,309 | $19,339 | $3,097 | $16,242 |
| 2023 | $3,204 | $19,000 | $2,490 | $16,510 |
| 2022 | $3,204 | $19,000 | $2,490 | $16,510 |
| 2021 | $3,151 | $18,999 | $2,489 | $16,510 |
| 2020 | $3,087 | $16,961 | $1,307 | $15,654 |
| 2019 | $3,760 | $18,715 | $1,307 | $17,408 |
| 2018 | $3,697 | $18,715 | $1,307 | $17,408 |
| 2017 | $2,427 | $14,649 | $1,120 | $13,529 |
| 2016 | $2,434 | $14,649 | $1,120 | $13,529 |
| 2015 | $2,684 | $14,649 | $1,120 | $13,529 |
| 2014 | $2,919 | $15,731 | $840 | $14,891 |
| 2013 | $2,383 | $15,731 | $840 | $14,891 |
Source: Public Records
Map
Nearby Homes
- 2248 W Ainslie St
- 2224 W Eastwood Ave
- 2135 W Leland Ave
- 4700 N Western Ave Unit 4B
- 4814 N Damen Ave Unit 209
- 5011 N Western Ave
- 5058 N Claremont Ave Unit 2E
- 2201 W Winona St Unit 2201G
- 4906 N Winchester Ave
- 2527 W Argyle St
- 1949 W Argyle St Unit 19491
- 4726 N Winchester Ave Unit C
- 4726 N Winchester Ave Unit F
- 2455 W Leland Ave Unit 1
- 5015 N Damen Ave
- 4948 N Winchester Ave
- 2352 W Winona St Unit 3E
- 2307 W Foster Ave Unit 3
- 2307 W Foster Ave Unit 2
- 2307 W Foster Ave Unit 1
- 2217 W Ainslie St Unit 22173
- 2215 W Ainslie St Unit 22152
- 2225 W Ainslie St Unit 22253
- 2223 W Ainslie St Unit 22231
- 2223 W Ainslie St Unit 22233
- 2225 W Ainslie St Unit 22252
- 2225 W Ainslie St Unit 22251
- 2223 W Ainslie St Unit 22232
- 2217 W Ainslie St Unit 22172
- 2217 W Ainslie St Unit 22171
- 2215 W Ainslie St Unit 22153
- 2215 W Ainslie St Unit 22151
- 2215 W Ainslie St Unit 1
- 2223 W Ainslie St Unit 3
- 2225 W Ainslie St Unit 3
- 2225 W Ainslie St Unit 2B
- 2223 W Ainslie St Unit U2
- 2217 W Ainslie St Unit 2
- 2217 W Ainslie St Unit 1
- 2215 W Ainslie St Unit 3