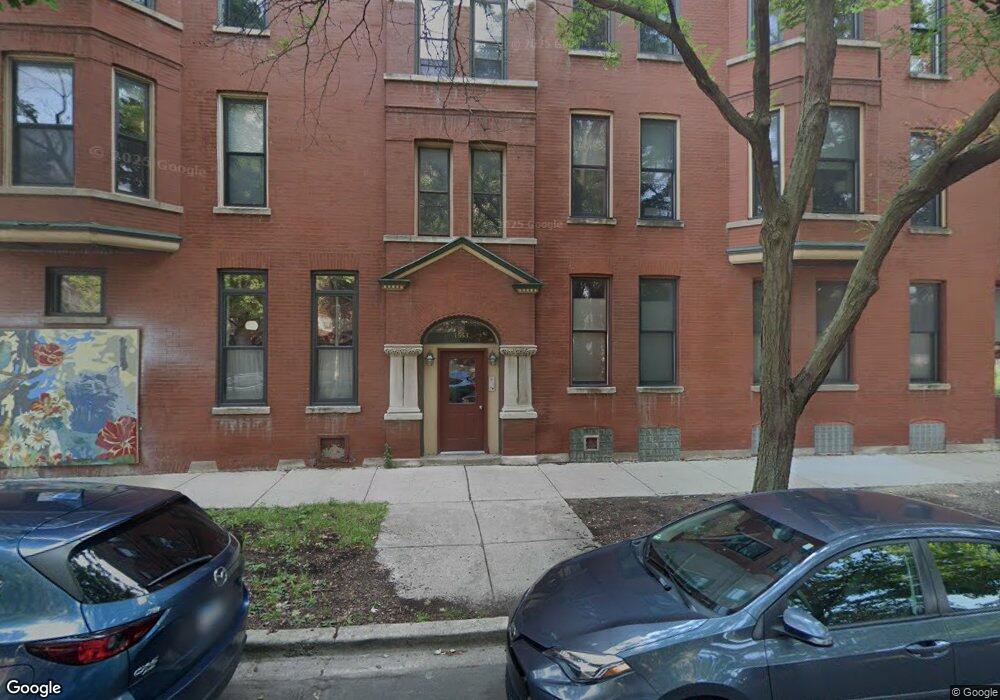
2223 W North Ave Unit 2F Chicago, IL 60647
Wicker Park NeighborhoodEstimated Value: $502,573 - $583,000
--
Bed
--
Bath
8,847
Sq Ft
$61/Sq Ft
Est. Value
About This Home
This home is located at 2223 W North Ave Unit 2F, Chicago, IL 60647 and is currently estimated at $540,143, approximately $61 per square foot. 2223 W North Ave Unit 2F is a home located in Cook County with nearby schools including José de Diego Community Academy, Clemente Community Academy High School, and Guidepost Montessori at Wicker Park.
Ownership History
Date
Name
Owned For
Owner Type
Purchase Details
Closed on
Apr 23, 2024
Sold by
Hampton Rebecca L
Bought by
Neumayer Anthony
Current Estimated Value
Home Financials for this Owner
Home Financials are based on the most recent Mortgage that was taken out on this home.
Original Mortgage
$369,000
Outstanding Balance
$363,601
Interest Rate
6.99%
Mortgage Type
New Conventional
Estimated Equity
$176,542
Purchase Details
Closed on
Oct 23, 2008
Sold by
Ngo Fiona I B and Obrien Genevieve Erin
Bought by
Obrien Thomas Patrick and Obrien Marguerite N
Purchase Details
Closed on
Jul 14, 2006
Sold by
2223 North Inc
Bought by
Ngo Fiona I B and Obrien Genevieve Erin
Home Financials for this Owner
Home Financials are based on the most recent Mortgage that was taken out on this home.
Original Mortgage
$207,200
Interest Rate
6.73%
Mortgage Type
Unknown
Create a Home Valuation Report for This Property
The Home Valuation Report is an in-depth analysis detailing your home's value as well as a comparison with similar homes in the area
Home Values in the Area
Average Home Value in this Area
Purchase History
| Date | Buyer | Sale Price | Title Company |
|---|---|---|---|
| Neumayer Anthony | $492,000 | None Listed On Document | |
| Obrien Thomas Patrick | $104,000 | Cti | |
| Ngo Fiona I B | $259,000 | Multiple |
Source: Public Records
Mortgage History
| Date | Status | Borrower | Loan Amount |
|---|---|---|---|
| Open | Neumayer Anthony | $369,000 | |
| Previous Owner | Ngo Fiona I B | $207,200 |
Source: Public Records
Tax History Compared to Growth
Tax History
| Year | Tax Paid | Tax Assessment Tax Assessment Total Assessment is a certain percentage of the fair market value that is determined by local assessors to be the total taxable value of land and additions on the property. | Land | Improvement |
|---|---|---|---|---|
| 2024 | $7,926 | $39,381 | $4,387 | $34,994 |
| 2023 | $7,705 | $36,436 | $2,006 | $34,430 |
| 2022 | $7,705 | $36,436 | $2,006 | $34,430 |
| 2021 | $7,531 | $36,435 | $2,006 | $34,429 |
| 2020 | $7,583 | $33,017 | $2,006 | $31,011 |
| 2019 | $7,429 | $35,864 | $2,006 | $33,858 |
| 2018 | $7,308 | $35,864 | $2,006 | $33,858 |
| 2017 | $5,600 | $25,177 | $1,763 | $23,414 |
| 2016 | $5,231 | $25,177 | $1,763 | $23,414 |
| 2015 | $4,796 | $25,177 | $1,763 | $23,414 |
| 2014 | $4,283 | $22,167 | $1,565 | $20,602 |
| 2013 | $4,211 | $22,167 | $1,565 | $20,602 |
Source: Public Records
Map
Nearby Homes
- 1552 N Leavitt St Unit 1552
- 1526 N Leavitt St Unit 1
- 2150 W North Ave Unit 4
- 2130 W North Ave Unit 303
- 1646 N Leavitt St
- 2113 W Concord Place
- 1452 N Leavitt St Unit 3
- 1633 N Oakley Ave Unit 3
- 1618 N Oakley Ave Unit 2S
- 2138 W Caton St
- 2201 W Wabansia Ave Unit 11
- 2052 W North Ave Unit 2E
- 2219 W Wabansia Ave Unit 3
- 1433 N Oakley Blvd
- 1540 N Claremont Ave Unit 1W
- 2144 W Schiller St Unit H
- 1724 N Winnebago Ave Unit B
- 2315 W Wabansia Ave Unit 2W
- 1410 N Hoyne Ave Unit 1A
- 1527 N Western Ave
- 2223 W North Ave Unit 3M
- 2223 W North Ave Unit 3F
- 2223 W North Ave Unit 2R
- 2223 W North Ave Unit 2M
- 2223 W North Ave Unit 1R
- 2223 W North Ave Unit 1M
- 2221 W North Ave Unit 1
- 2221 W North Ave
- 2221 W North Ave Unit 3
- 2221 W North Ave Unit 2
- 1549 N Bell Ave Unit 3R
- 1549 N Bell Ave Unit 2R
- 1549 N Bell Ave Unit 1R
- 1553 N Bell Ave Unit 3F
- 1553 N Bell Ave Unit 2M
- 1553 N Bell Ave Unit 1M
- 1553 N Bell Ave Unit 2F
- 2219 W North Ave
- 2215 W North Ave
- 1545 N Bell Ave