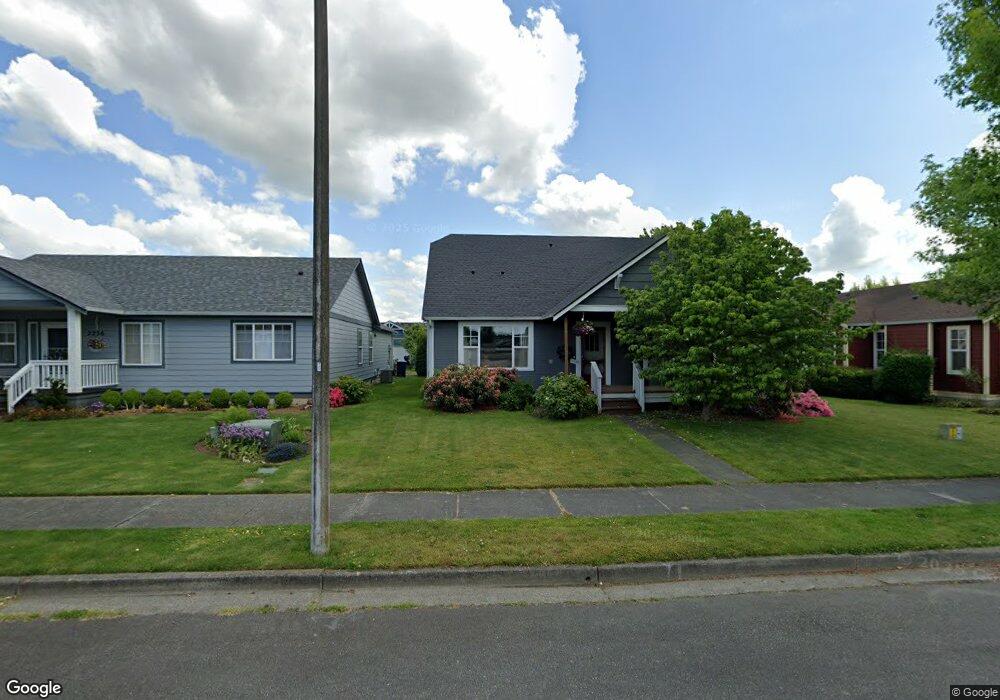
2224 Cherry St Lynden, WA 98264
Estimated Value: $552,000 - $594,000
3
Beds
3
Baths
1,836
Sq Ft
$313/Sq Ft
Est. Value
About This Home
This home is located at 2224 Cherry St, Lynden, WA 98264 and is currently estimated at $574,556, approximately $312 per square foot. 2224 Cherry St is a home located in Whatcom County with nearby schools including Lynden High School, Lynden Christian Schools: Administration, and Cornerstone Christian School.
Ownership History
Date
Name
Owned For
Owner Type
Purchase Details
Closed on
Mar 17, 2005
Sold by
Mitchell William G and Mitchell Michelle E
Bought by
Clark Gordon L and Clark Sharon A
Current Estimated Value
Home Financials for this Owner
Home Financials are based on the most recent Mortgage that was taken out on this home.
Original Mortgage
$180,000
Outstanding Balance
$90,771
Interest Rate
5.53%
Mortgage Type
Purchase Money Mortgage
Estimated Equity
$483,785
Purchase Details
Closed on
Jun 20, 2003
Sold by
Aanestad Lisa M
Bought by
Mitchell William G and Mitchell Michelle Elizabeth
Home Financials for this Owner
Home Financials are based on the most recent Mortgage that was taken out on this home.
Original Mortgage
$159,600
Interest Rate
5.53%
Mortgage Type
Purchase Money Mortgage
Create a Home Valuation Report for This Property
The Home Valuation Report is an in-depth analysis detailing your home's value as well as a comparison with similar homes in the area
Home Values in the Area
Average Home Value in this Area
Purchase History
| Date | Buyer | Sale Price | Title Company |
|---|---|---|---|
| Clark Gordon L | $214,500 | Chicago Title Insurance | |
| Mitchell William G | $168,000 | Stewart Title Company |
Source: Public Records
Mortgage History
| Date | Status | Borrower | Loan Amount |
|---|---|---|---|
| Open | Clark Gordon L | $180,000 | |
| Previous Owner | Mitchell William G | $159,600 |
Source: Public Records
Tax History Compared to Growth
Tax History
| Year | Tax Paid | Tax Assessment Tax Assessment Total Assessment is a certain percentage of the fair market value that is determined by local assessors to be the total taxable value of land and additions on the property. | Land | Improvement |
|---|---|---|---|---|
| 2024 | $3,544 | $498,318 | $194,000 | $304,318 |
| 2023 | $3,544 | $492,613 | $200,000 | $292,613 |
| 2022 | $3,296 | $432,239 | $140,798 | $291,441 |
| 2021 | $3,233 | $357,217 | $116,360 | $240,857 |
| 2020 | $2,832 | $318,953 | $103,896 | $215,057 |
| 2019 | $2,520 | $292,529 | $95,394 | $197,135 |
| 2018 | $2,754 | $266,776 | $86,900 | $179,876 |
| 2017 | $2,434 | $239,454 | $78,000 | $161,454 |
| 2016 | $2,298 | $225,083 | $68,200 | $156,883 |
| 2015 | $2,037 | $211,288 | $65,596 | $145,692 |
| 2014 | -- | $204,129 | $63,364 | $140,765 |
| 2013 | -- | $202,765 | $62,000 | $140,765 |
Source: Public Records
Map
Nearby Homes
- 2205 Dejong Dr
- 2201 Dejong Dr
- 8885 Line Rd
- 1725 Aaron Dr
- 2202 Berryman Loop
- 1660 Eastwood Way
- 1136 N Cascade Ct
- 1112 N Cascade Ct
- 1402 Bradley Meadows Ln
- 1319 Bradley Ct
- 1251 Garden Cir
- 9586 Bender Rd
- 1340 Kamm Rd
- 2021 Brome St
- 2029 Brome St
- 8639 Bender Rd
- 1792 Bradley Rd
- 8865 Northwood Rd
- 114 Twin Sister Loop
- 1178 E Grover St Unit 101
- 2236 Cherry St
- 2212 Cherry St
- 2248 Cherry St
- 2200 Cherry St
- 2225 Dogwood St
- 2237 Dogwood St
- 2213 Dogwood St
- 2249 Dogwood St
- 2201 Dogwood St
- 1208 Spruce Cir
- 1277 Aaron Dr
- 2261 Dogwood St
- 2229 Cherry St Unit 12B
- 2272 Cherry St
- 2136 Cherry St
- 1220 Spruce Cir Unit B
- 1220 Spruce Cir Unit A
- 2273 Dogwood St
- 2277 Cherry St Unit 11B
- 2284 Cherry St