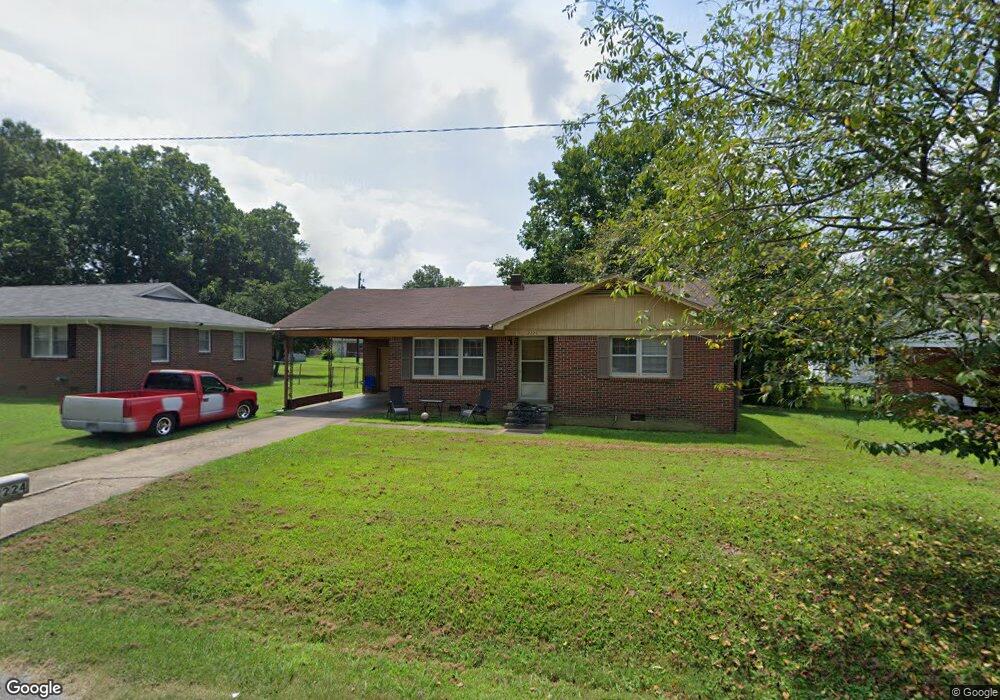
2224 Mcdearmon Ave Humboldt, TN 38343
Estimated Value: $92,000 - $106,507
--
Bed
1
Bath
1,158
Sq Ft
$87/Sq Ft
Est. Value
About This Home
This home is located at 2224 Mcdearmon Ave, Humboldt, TN 38343 and is currently estimated at $100,377, approximately $86 per square foot. 2224 Mcdearmon Ave is a home located in Gibson County with nearby schools including Stigall Primary School, East Elementary School, and Humboldt Middle School.
Ownership History
Date
Name
Owned For
Owner Type
Purchase Details
Closed on
Nov 29, 2017
Sold by
Scarbrough Ed
Bought by
Bass John R and Bass Tammy
Current Estimated Value
Purchase Details
Closed on
Feb 17, 2009
Sold by
Bass Robbie
Bought by
Bass John R
Home Financials for this Owner
Home Financials are based on the most recent Mortgage that was taken out on this home.
Original Mortgage
$42,000
Interest Rate
5.15%
Purchase Details
Closed on
Nov 26, 2008
Sold by
Federal Home Loan Mortgage Corporation
Bought by
Bass Robbie
Purchase Details
Closed on
Jul 16, 2008
Sold by
Griffin Brian
Bought by
Federal Home Loan Mortgage Corporation
Purchase Details
Closed on
Feb 25, 2000
Sold by
Reasons Raymond L
Bought by
Reasons Raymond L
Purchase Details
Closed on
May 14, 1998
Sold by
Hunt Hillard I
Bought by
Reasons Raymond L and Reasons Alice
Purchase Details
Closed on
Jan 1, 1984
Bought by
Hunt Hillard I and Hunt Nancy L
Purchase Details
Closed on
Jan 3, 1900
Purchase Details
Closed on
Jan 2, 1900
Create a Home Valuation Report for This Property
The Home Valuation Report is an in-depth analysis detailing your home's value as well as a comparison with similar homes in the area
Home Values in the Area
Average Home Value in this Area
Purchase History
| Date | Buyer | Sale Price | Title Company |
|---|---|---|---|
| Bass John R | -- | -- | |
| Bass John R | -- | -- | |
| Bass Robbie | $28,958 | -- | |
| Federal Home Loan Mortgage Corporation | -- | -- | |
| Reasons Raymond L | -- | -- | |
| Reasons Raymond L | $56,304 | -- | |
| Hunt Hillard I | $33,000 | -- | |
| -- | -- | -- | |
| -- | -- | -- |
Source: Public Records
Mortgage History
| Date | Status | Borrower | Loan Amount |
|---|---|---|---|
| Previous Owner | Not Available | $42,000 |
Source: Public Records
Tax History Compared to Growth
Tax History
| Year | Tax Paid | Tax Assessment Tax Assessment Total Assessment is a certain percentage of the fair market value that is determined by local assessors to be the total taxable value of land and additions on the property. | Land | Improvement |
|---|---|---|---|---|
| 2025 | $564 | $20,800 | $0 | $0 |
| 2024 | $564 | $20,800 | $3,250 | $17,550 |
| 2023 | $143 | $12,975 | $2,000 | $10,975 |
| 2022 | $134 | $12,975 | $2,000 | $10,975 |
| 2021 | $134 | $12,975 | $2,000 | $10,975 |
| 2020 | $488 | $12,975 | $2,000 | $10,975 |
| 2019 | $488 | $12,975 | $2,000 | $10,975 |
| 2018 | $469 | $11,550 | $2,000 | $9,550 |
| 2017 | $463 | $11,550 | $2,000 | $9,550 |
| 2016 | $463 | $11,550 | $2,000 | $9,550 |
| 2015 | $459 | $11,550 | $2,000 | $9,550 |
| 2014 | $459 | $11,550 | $2,000 | $9,550 |
Source: Public Records
Map
Nearby Homes
- 00000 Lot 7 Mullins St
- 0000 lot 6-C Mullins St
- 000Lot 6-B Mullins St
- 00-lot 6-A Mullins St
- 2310 Dodson St
- 2162 Dodson St
- 2107 Campbell St
- 1438 N 19th Ave
- 0 Highway 45 Bypass
- 0 Eastend Dr
- 1338 Dungan St
- 1416 N 18th Ave
- 1730 Stallings Rd
- 1211 N 29th Ave
- 0 Viking Dr
- 1325 N 17th Ave
- 811 N 24th Ave
- 2508 Vine St
- 3117 Laurel St
- 2425 St Mary Dr
- 2320 Mcdearmon Ave
- 2228 Mcdearmon Ave
- 2314 Mcdearmon Ave
- 2233 Mullins Ave
- 2241 Mullins Ave
- 2231 Mullins Ave
- 2335 Mcdearmon Ave
- 2321 Mcdearmon Ave
- 2310 Mcdearmon Ave
- 2309 Mullins Ave
- 2240 Dodson St
- 2302 Dodson St
- 2315 Mcdearmon Ave
- 2227 Mullins Ave
- 2232 Dodson St
- 2305 Mullins Ave
- 2304 Dodson St
- 2308 Dodson St
- 2224 Dodson St
- Lot 10 Dodson St