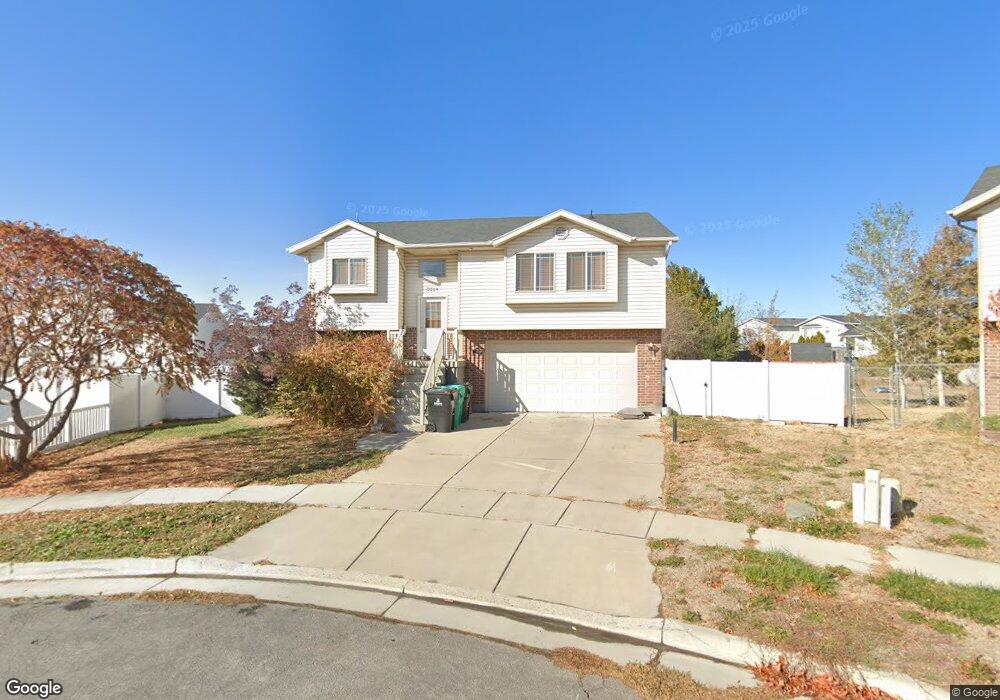
2224 S 2685 W Syracuse, UT 84075
Estimated Value: $423,000 - $471,000
4
Beds
2
Baths
1,711
Sq Ft
$263/Sq Ft
Est. Value
About This Home
This home is located at 2224 S 2685 W, Syracuse, UT 84075 and is currently estimated at $449,209, approximately $262 per square foot. 2224 S 2685 W is a home located in Davis County with nearby schools including Buffalo Point School, Syracuse Junior High School, and Syracuse High School.
Ownership History
Date
Name
Owned For
Owner Type
Purchase Details
Closed on
Apr 19, 2013
Sold by
Stagge Nicholas and Stagge Terryn
Bought by
American Homes 4 Rent Properties Three L
Current Estimated Value
Purchase Details
Closed on
Sep 8, 2005
Sold by
Stagge Nicholas
Bought by
Stagge Nicholas and Stagge Terryn
Home Financials for this Owner
Home Financials are based on the most recent Mortgage that was taken out on this home.
Original Mortgage
$8,787
Interest Rate
5.7%
Mortgage Type
Stand Alone Second
Purchase Details
Closed on
Mar 8, 2005
Sold by
Out West Developers L L C
Bought by
Lessig Gary and Snovi Ron
Create a Home Valuation Report for This Property
The Home Valuation Report is an in-depth analysis detailing your home's value as well as a comparison with similar homes in the area
Home Values in the Area
Average Home Value in this Area
Purchase History
| Date | Buyer | Sale Price | Title Company |
|---|---|---|---|
| American Homes 4 Rent Properties Three L | -- | Inwest Title Services Inc | |
| Stagge Nicholas | -- | -- | |
| Stagge Nicholas | -- | Heritage West Title Ins Agen | |
| Lessig Gary | -- | Heritage West Title Ins Agen |
Source: Public Records
Mortgage History
| Date | Status | Borrower | Loan Amount |
|---|---|---|---|
| Previous Owner | Stagge Nicholas | $8,787 | |
| Previous Owner | Stagge Nicholas | $146,596 |
Source: Public Records
Tax History Compared to Growth
Tax History
| Year | Tax Paid | Tax Assessment Tax Assessment Total Assessment is a certain percentage of the fair market value that is determined by local assessors to be the total taxable value of land and additions on the property. | Land | Improvement |
|---|---|---|---|---|
| 2025 | $2,269 | $218,900 | $110,135 | $108,765 |
| 2024 | $2,288 | $222,200 | $84,843 | $137,357 |
| 2023 | $2,124 | $206,800 | $72,919 | $133,881 |
| 2022 | $2,307 | $407,000 | $117,464 | $289,536 |
| 2021 | $2,004 | $301,000 | $94,412 | $206,588 |
| 2020 | $1,774 | $258,000 | $74,176 | $183,824 |
| 2019 | $1,714 | $246,000 | $79,224 | $166,776 |
| 2018 | $1,399 | $199,284 | $77,721 | $121,563 |
| 2016 | $1,342 | $100,320 | $33,460 | $66,860 |
| 2015 | $1,315 | $93,610 | $33,460 | $60,150 |
| 2014 | $1,331 | $96,545 | $33,460 | $63,085 |
| 2013 | -- | $89,313 | $25,850 | $63,463 |
Source: Public Records
Map
Nearby Homes
- 2961 S 2425 W Unit 1123
- 2696 2495 S Unit 207
- 2297 W 2175 S
- 2524 S 3590 W Unit 602
- 2965 S 3000 W
- 2971 S 2425 W Unit 1124
- 2686 S 2440 W Unit 101
- 2635 S 2430 W Unit 114
- 3062 W Solace St
- 2574 S 2430 W Unit 503
- 2982 S 3000 W
- 2912 S 3000 W
- 2237 Craig Ln
- 2679 W Antelope Dr
- 4344 W 1825 S Unit 102
- 4354 W 1825 S Unit 104
- 4348 W 1825 S Unit 103
- 2455 S Bluff Rd
- 2136 W 2200 S
- 2735 S Shoreline Dr