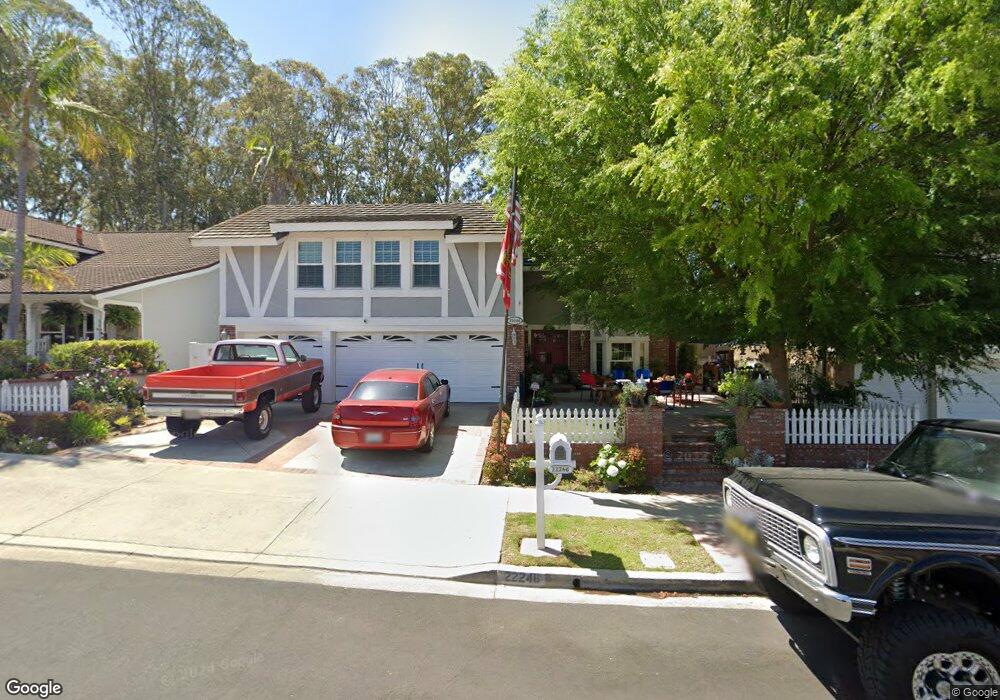
22246 Anthony Dr Lake Forest, CA 92630
Estimated Value: $1,411,000 - $1,644,000
4
Beds
3
Baths
3,146
Sq Ft
$487/Sq Ft
Est. Value
About This Home
This home is located at 22246 Anthony Dr, Lake Forest, CA 92630 and is currently estimated at $1,532,551, approximately $487 per square foot. 22246 Anthony Dr is a home located in Orange County with nearby schools including Santiago STEAM Magnet Elementary School, Serrano Intermediate School, and El Toro High School.
Ownership History
Date
Name
Owned For
Owner Type
Purchase Details
Closed on
Aug 25, 2022
Sold by
Roberts Wendy J and Roberts Wendy J
Bought by
Roberts Family Living Trust
Current Estimated Value
Purchase Details
Closed on
Nov 3, 2017
Sold by
Roberts Tony D and Roberts Wendy J
Bought by
Roberts Tony D and Roberts Wendy J
Purchase Details
Closed on
Jul 15, 2013
Sold by
Roberts Tony D and Roberts Wendy J
Bought by
Roberts Tony D and Roberts Wendy J
Purchase Details
Closed on
May 11, 1999
Sold by
Lovejoy Gail M
Bought by
Roberts Tony D and Roberts Wendy J
Home Financials for this Owner
Home Financials are based on the most recent Mortgage that was taken out on this home.
Original Mortgage
$250,250
Interest Rate
6.84%
Mortgage Type
Stand Alone First
Purchase Details
Closed on
Feb 4, 1994
Sold by
Lovejoy William Winfield and Lovejoy Gail Margaret
Bought by
Lovejoy William W J and Lovejoy Gail M
Create a Home Valuation Report for This Property
The Home Valuation Report is an in-depth analysis detailing your home's value as well as a comparison with similar homes in the area
Home Values in the Area
Average Home Value in this Area
Purchase History
| Date | Buyer | Sale Price | Title Company |
|---|---|---|---|
| Roberts Family Living Trust | -- | None Listed On Document | |
| Roberts Tony D | -- | None Available | |
| Roberts Tony D | -- | None Available | |
| Roberts Tony D | $357,500 | Fidelity National Title Ins | |
| Lovejoy William W J | -- | -- |
Source: Public Records
Mortgage History
| Date | Status | Borrower | Loan Amount |
|---|---|---|---|
| Previous Owner | Roberts Tony D | $250,250 | |
| Closed | Roberts Tony D | $71,500 |
Source: Public Records
Tax History Compared to Growth
Tax History
| Year | Tax Paid | Tax Assessment Tax Assessment Total Assessment is a certain percentage of the fair market value that is determined by local assessors to be the total taxable value of land and additions on the property. | Land | Improvement |
|---|---|---|---|---|
| 2025 | $6,063 | $600,198 | $235,631 | $364,567 |
| 2024 | $6,063 | $588,430 | $231,011 | $357,419 |
| 2023 | $5,919 | $576,893 | $226,482 | $350,411 |
| 2022 | $5,812 | $565,582 | $222,041 | $343,541 |
| 2021 | $5,695 | $554,493 | $217,688 | $336,805 |
| 2020 | $5,644 | $548,808 | $215,456 | $333,352 |
| 2019 | $5,530 | $538,048 | $211,232 | $326,816 |
| 2018 | $5,425 | $527,499 | $207,091 | $320,408 |
| 2017 | $5,316 | $517,156 | $203,030 | $314,126 |
| 2016 | $5,227 | $507,016 | $199,049 | $307,967 |
| 2015 | $5,162 | $499,401 | $196,059 | $303,342 |
| 2014 | $5,049 | $489,619 | $192,219 | $297,400 |
Source: Public Records
Map
Nearby Homes
- 24661 Woodhill Ln
- 22235 Vista Verde Dr
- 24481 Peacock St
- 24465 Peacock St
- 24802 Forest Knoll Ln
- 24708 Toledo Ln
- 24946 Ravenswood
- 21886 Winnebago Ln
- 24966 Valley Rim Terrace
- 21922 Erie Ln
- 24771 Summerwind Ln
- 22482 Lake Forest Ln
- 24311 Peacock St
- 21907 Erie Ln
- 24975 Heartwood Cir
- 25011 Mammoth Cir
- 21875 Huron Ln
- 24001 Muirlands Blvd Unit 347
- 24001 Muirlands Blvd Unit 315
- 24001 Muirlands Blvd Unit 47
- 22242 Anthony Dr
- 22252 Anthony Dr
- 22305 Parkwood St
- 22311 Parkwood St
- 22236 Anthony Dr
- 22256 Anthony Dr
- 22301 Parkwood St
- 22245 Anthony Dr
- 22315 Parkwood St
- 22251 Anthony Dr
- 22241 Anthony Dr
- 22291 Parkwood St
- 22232 Anthony Dr
- 22262 Anthony Dr
- 22231 Anthony Dr
- 22261 Anthony Dr
- 22281 Parkwood St
- 22226 Anthony Dr
- 24606 Donna Ln
- 24605 Donna Ln