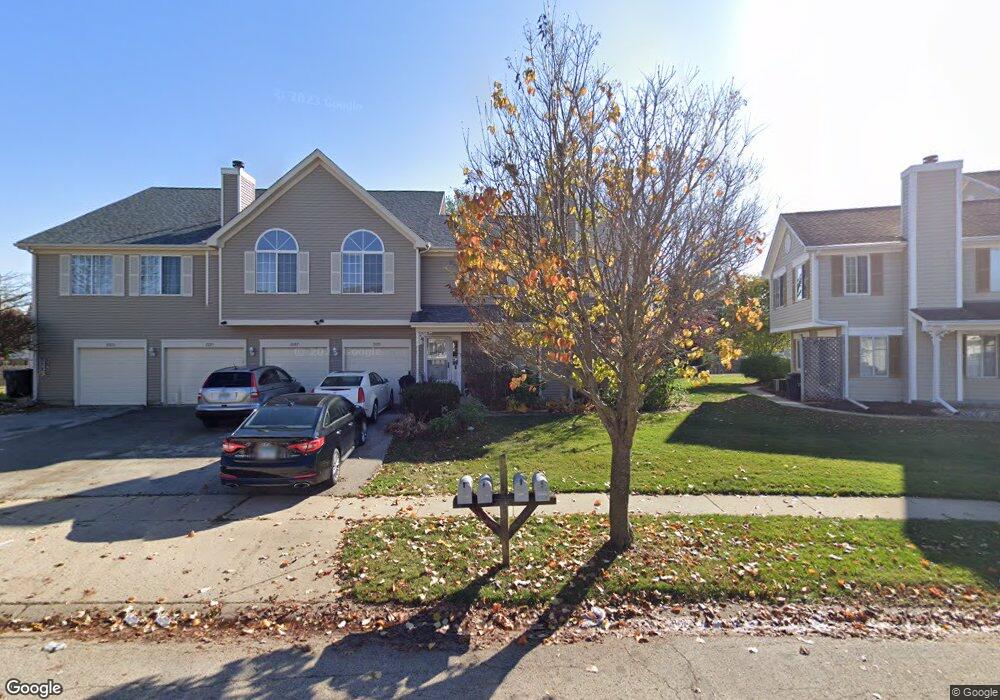
2225 Colorado Ave Unit 1 Elgin, IL 60123
Far West Elgin NeighborhoodEstimated Value: $249,000 - $261,322
3
Beds
2
Baths
1,220
Sq Ft
$209/Sq Ft
Est. Value
About This Home
This home is located at 2225 Colorado Ave Unit 1, Elgin, IL 60123 and is currently estimated at $254,581, approximately $208 per square foot. 2225 Colorado Ave Unit 1 is a home located in Kane County with nearby schools including Creekside Elementary School, Kimball Middle School, and Larkin High School.
Ownership History
Date
Name
Owned For
Owner Type
Purchase Details
Closed on
Dec 6, 2007
Sold by
Marshall Marshan and Marshall Victoria M
Bought by
Marshall Victoria M
Current Estimated Value
Purchase Details
Closed on
Apr 2, 2002
Sold by
Fortune Robert
Bought by
Marshall Marshan and Marshall Victoria
Home Financials for this Owner
Home Financials are based on the most recent Mortgage that was taken out on this home.
Original Mortgage
$129,209
Outstanding Balance
$52,519
Interest Rate
6.82%
Mortgage Type
FHA
Estimated Equity
$202,062
Purchase Details
Closed on
Nov 20, 2000
Sold by
Purich Marina
Bought by
Fortune Robert
Home Financials for this Owner
Home Financials are based on the most recent Mortgage that was taken out on this home.
Original Mortgage
$96,000
Interest Rate
7.8%
Mortgage Type
Balloon
Create a Home Valuation Report for This Property
The Home Valuation Report is an in-depth analysis detailing your home's value as well as a comparison with similar homes in the area
Home Values in the Area
Average Home Value in this Area
Purchase History
| Date | Buyer | Sale Price | Title Company |
|---|---|---|---|
| Marshall Victoria M | -- | None Available | |
| Marshall Marshan | $133,000 | First American Title Co | |
| Fortune Robert | $120,000 | Chicago Title Insurance Co |
Source: Public Records
Mortgage History
| Date | Status | Borrower | Loan Amount |
|---|---|---|---|
| Open | Marshall Marshan | $129,209 | |
| Previous Owner | Fortune Robert | $96,000 |
Source: Public Records
Tax History Compared to Growth
Tax History
| Year | Tax Paid | Tax Assessment Tax Assessment Total Assessment is a certain percentage of the fair market value that is determined by local assessors to be the total taxable value of land and additions on the property. | Land | Improvement |
|---|---|---|---|---|
| 2024 | $4,500 | $64,224 | $17,175 | $47,049 |
| 2023 | $4,264 | $58,021 | $15,516 | $42,505 |
| 2022 | $4,067 | $52,905 | $14,148 | $38,757 |
| 2021 | $3,878 | $49,462 | $13,227 | $36,235 |
| 2020 | $3,759 | $47,219 | $12,627 | $34,592 |
| 2019 | $3,641 | $44,979 | $12,028 | $32,951 |
| 2018 | $3,596 | $42,373 | $11,331 | $31,042 |
| 2017 | $3,503 | $40,058 | $10,712 | $29,346 |
| 2016 | $3,324 | $37,163 | $9,938 | $27,225 |
| 2015 | -- | $34,063 | $9,109 | $24,954 |
| 2014 | -- | $31,402 | $8,997 | $22,405 |
| 2013 | -- | $32,230 | $9,234 | $22,996 |
Source: Public Records
Map
Nearby Homes
- 2214 Colorado Ave Unit 4
- 2133 Colorado Ave Unit 1
- 660 Robin Ridge
- Lot 1 Highland Springs Dr
- 640 Highland Springs Dr
- 609 N Lyle Ave
- Geneva Plan at The Villas at Madison Lane
- 691 Canyon Ln
- 519 Shagbark Dr
- 949 Millcreek Cir
- 520 N Lyle Ave
- 900 Ruth Dr
- 900 Glenmore Ln
- 1995 Salem Rd
- 908 Glenmore Ln
- 2013 Jeffrey Ln Unit 2013
- 92 N Airlite St
- 1755 Country Knoll Ln Unit 11
- 801 N Mclean Blvd Unit 226
- 801 N Mclean Blvd Unit 320
- 2221 Colorado Ave Unit 3
- 2231 Colorado Ave Unit 2
- 2233 Colorado Ave Unit 1
- 2215 Colorado Ave Unit 1
- 2224 Colorado Ave Unit 1
- 2220 Colorado Ave Unit 3
- 2217 Colorado Ave Unit 2
- 2183 Colorado Ave Unit 4
- 2256 Valley Creek Dr Unit 3
- 2195 Colorado Ave Unit 4
- 2262 Valley Creek Dr Unit 2
- 2177 Colorado Ave Unit 2
- 2213 Colorado Ave Unit D
- 2187 Colorado Ave Unit 2
- 2268 Valley Creek Dr Unit 4
- 2197 Colorado Ave Unit 3
- 2207 Colorado Ave Unit 3
- 2227 Colorado Ave Unit 2
- 2235 Colorado Ave Unit 4
- 2223 Colorado Ave