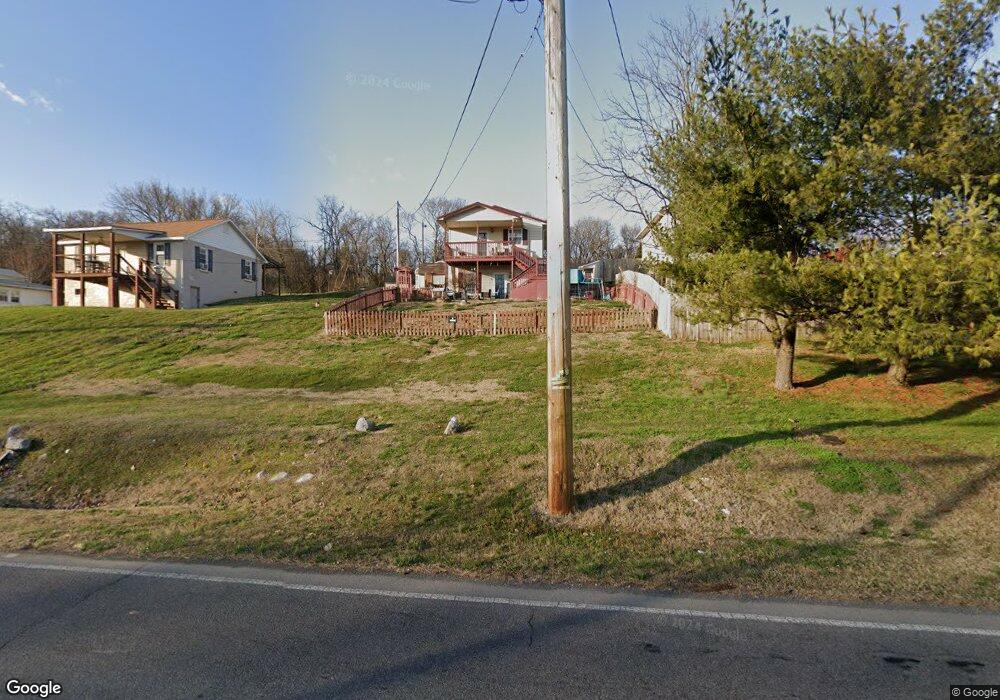
2225 Netherland Inn Terrace Kingsport, TN 37660
Estimated Value: $119,301 - $183,000
--
Bed
2
Baths
594
Sq Ft
$251/Sq Ft
Est. Value
About This Home
This home is located at 2225 Netherland Inn Terrace, Kingsport, TN 37660 and is currently estimated at $149,325, approximately $251 per square foot. 2225 Netherland Inn Terrace is a home located in Sullivan County with nearby schools including Andrew Jackson Elementary School, John Sevier Middle School, and Ross N. Robinson Middle School.
Ownership History
Date
Name
Owned For
Owner Type
Purchase Details
Closed on
Sep 18, 2023
Sold by
Mcnutt Ezra D B and Mcnutt Cristy L
Bought by
Hall David Wayne and Hall Laura Shyanne
Current Estimated Value
Home Financials for this Owner
Home Financials are based on the most recent Mortgage that was taken out on this home.
Original Mortgage
$122,400
Outstanding Balance
$119,804
Interest Rate
6.96%
Mortgage Type
New Conventional
Estimated Equity
$29,521
Purchase Details
Closed on
Aug 2, 2023
Sold by
Mcnutt Ezra D B and Mcnutt Christy L
Bought by
Mcnutt Ezra D B and Hall Laura
Home Financials for this Owner
Home Financials are based on the most recent Mortgage that was taken out on this home.
Original Mortgage
$122,400
Outstanding Balance
$119,804
Interest Rate
6.96%
Mortgage Type
New Conventional
Estimated Equity
$29,521
Purchase Details
Closed on
Mar 2, 2001
Create a Home Valuation Report for This Property
The Home Valuation Report is an in-depth analysis detailing your home's value as well as a comparison with similar homes in the area
Home Values in the Area
Average Home Value in this Area
Purchase History
| Date | Buyer | Sale Price | Title Company |
|---|---|---|---|
| Hall David Wayne | -- | None Listed On Document | |
| Mcnutt Ezra D B | -- | None Listed On Document | |
| -- | $39,000 | -- |
Source: Public Records
Mortgage History
| Date | Status | Borrower | Loan Amount |
|---|---|---|---|
| Open | Hall David Wayne | $122,400 |
Source: Public Records
Tax History Compared to Growth
Tax History
| Year | Tax Paid | Tax Assessment Tax Assessment Total Assessment is a certain percentage of the fair market value that is determined by local assessors to be the total taxable value of land and additions on the property. | Land | Improvement |
|---|---|---|---|---|
| 2024 | -- | $19,750 | $1,875 | $17,875 |
| 2023 | $870 | $19,750 | $1,875 | $17,875 |
| 2022 | $870 | $19,750 | $1,875 | $17,875 |
| 2021 | $846 | $19,750 | $1,875 | $17,875 |
| 2020 | $481 | $19,750 | $1,875 | $17,875 |
| 2019 | $867 | $18,700 | $1,875 | $16,825 |
| 2018 | $846 | $18,700 | $1,875 | $16,825 |
| 2017 | $846 | $18,700 | $1,875 | $16,825 |
| 2016 | $779 | $16,775 | $1,875 | $14,900 |
| 2014 | $733 | $16,756 | $0 | $0 |
Source: Public Records
Map
Nearby Homes
- 252 River Edge Dr
- 305 Pleasley Rd
- 200 River Edge Dr
- 2424 Rivermont Dr
- 416 Ridgefields Rd
- 606 Hollis St
- 421 High Ridge Rd
- 1950 W Stone Dr
- 1011 Lawson Dr
- Tbd Ridgefields Rd
- 2449 Jennings Dr
- 241 Bent St
- 2228 Hall St
- 2001 Sand St
- 1833 Manor Ct
- 1401 W Stone Dr
- 517 Forestdale Rd
- 1801 Manor Ct Unit B
- 1824&1828 Netherland Inn Rd
- 461 Eastley Ct Unit 5
- 2224 Netherland Inn Rd
- 2221 Netherland Inn Terrace
- 2216 Netherland Inn Rd
- 2228 Netherland Inn Rd
- 2152 Netherland Inn Rd
- 2232 Netherland Inn Rd
- 2209 Netherland Inn Terrace
- 2236 Netherland Inn Rd
- 2201 Netherland Inn Terrace
- 2244 Netherland Inn Rd
- 2248 Netherland Inn Rd
- 2252 Netherland Inn Rd
- 2250 Netherland Inn Rd
- 2121 Fort Robinson Dr
- 105 Mary St
- 2317 Rivermont Dr
- 2313 Rivermont Dr
- 2113 Fort Robinson Dr
- 2309 Rivermont Dr
- 248 River Edge Dr