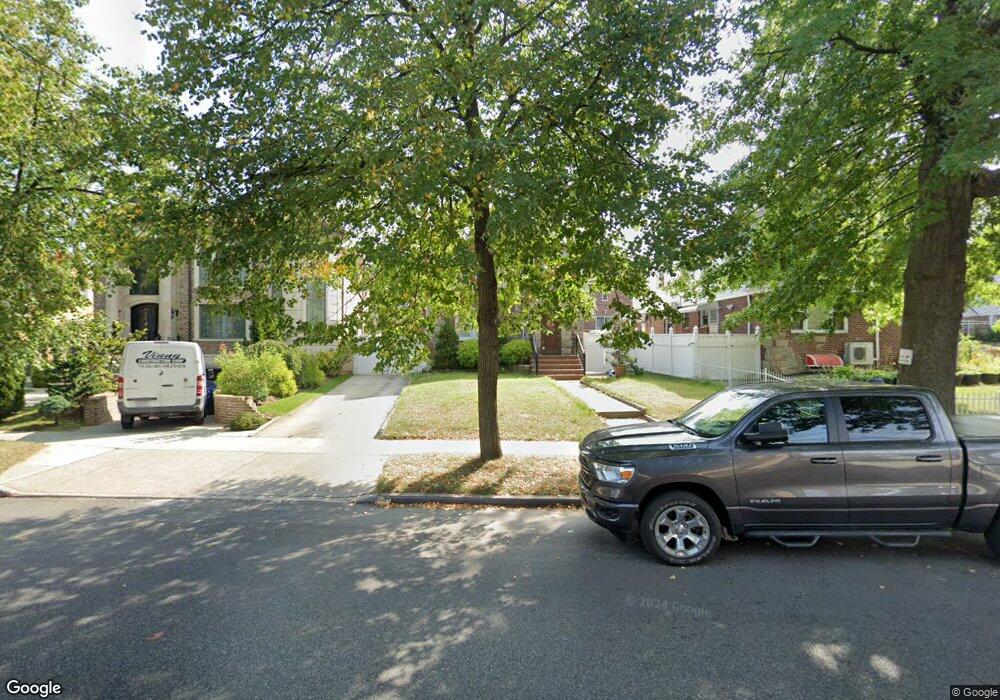
2225 Parsons Blvd Whitestone, NY 11357
Murray Hill-Broadway NeighborhoodEstimated Value: $1,048,000 - $1,353,000
Studio
--
Bath
1,532
Sq Ft
$809/Sq Ft
Est. Value
About This Home
This home is located at 2225 Parsons Blvd, Whitestone, NY 11357 and is currently estimated at $1,239,214, approximately $808 per square foot. 2225 Parsons Blvd is a home located in Queens County with nearby schools including P.S. 79 - Francis Lewis, Jhs 185 Edward Bleeker, and Flushing High School.
Ownership History
Date
Name
Owned For
Owner Type
Purchase Details
Closed on
Mar 8, 2023
Sold by
Antonopoulos Maria A and Antonopoulos Vassilios A
Bought by
Xiong Li
Current Estimated Value
Home Financials for this Owner
Home Financials are based on the most recent Mortgage that was taken out on this home.
Original Mortgage
$870,800
Outstanding Balance
$843,413
Interest Rate
6.12%
Mortgage Type
Purchase Money Mortgage
Estimated Equity
$395,801
Purchase Details
Closed on
Apr 16, 1999
Sold by
Smith John R and Smith Patricia
Bought by
Antonopoulos Vassilios A and Antonopoulos Maria A
Home Financials for this Owner
Home Financials are based on the most recent Mortgage that was taken out on this home.
Original Mortgage
$240,000
Interest Rate
6.88%
Purchase Details
Closed on
Jan 29, 1997
Sold by
Mcintyre Ida
Bought by
Smith John R and Smith Patricia
Home Financials for this Owner
Home Financials are based on the most recent Mortgage that was taken out on this home.
Original Mortgage
$158,000
Interest Rate
6.93%
Create a Home Valuation Report for This Property
The Home Valuation Report is an in-depth analysis detailing your home's value as well as a comparison with similar homes in the area
Home Values in the Area
Average Home Value in this Area
Purchase History
| Date | Buyer | Sale Price | Title Company |
|---|---|---|---|
| Xiong Li | $1,244,000 | -- | |
| Antonopoulos Vassilios A | $270,000 | Fidelity National Title Ins | |
| Smith John R | $208,000 | Chicago Title Insurance Co |
Source: Public Records
Mortgage History
| Date | Status | Borrower | Loan Amount |
|---|---|---|---|
| Open | Xiong Li | $870,800 | |
| Previous Owner | Antonopoulos Vassilios A | $240,000 | |
| Previous Owner | Smith John R | $158,000 |
Source: Public Records
Tax History
| Year | Tax Paid | Tax Assessment Tax Assessment Total Assessment is a certain percentage of the fair market value that is determined by local assessors to be the total taxable value of land and additions on the property. | Land | Improvement |
|---|---|---|---|---|
| 2025 | $9,413 | $47,975 | $17,947 | $30,028 |
| 2024 | $9,413 | $46,866 | $17,569 | $29,297 |
| 2023 | $8,894 | $44,284 | $15,153 | $29,131 |
| 2022 | $8,123 | $66,480 | $21,660 | $44,820 |
| 2021 | $8,119 | $59,880 | $21,660 | $38,220 |
| 2020 | $8,162 | $55,740 | $21,660 | $34,080 |
| 2019 | $7,877 | $61,380 | $21,660 | $39,720 |
| 2018 | $7,225 | $36,903 | $13,580 | $23,323 |
| 2017 | $6,858 | $35,112 | $14,387 | $20,725 |
| 2016 | $6,351 | $35,112 | $14,387 | $20,725 |
| 2015 | $3,775 | $33,316 | $17,509 | $15,807 |
| 2014 | $3,775 | $32,546 | $16,668 | $15,878 |
Source: Public Records
Map
Nearby Homes
- 21-12 144th St
- 14315 22nd Rd
- 2023 Whitestone Expy
- 145-17 Willets Point Blvd
- 23-38 144th St
- 2311 Whitestone Expy
- 14632 Willets Point Blvd
- 14718 24th Ave
- 14464 25th Rd
- 14445 25th Dr
- 147-16 20th Ave
- 22-01 149th St
- 25-11 Union St Unit 2A
- 25-12 Union St Unit 3B
- 142-15 26th Ave Unit 4D
- 14215 26th Ave Unit 5F
- 15-43 144th St
- 142-21 26th Ave Unit 4F
- 142-21 26th Ave Unit 6E
- 142-21 26th Ave Unit 1D
- 2225 Parsons Blvd
- 14505 23rd Ave
- 2221 Parsons Blvd
- 14515 23rd Ave
- 2217 Parsons Blvd
- 14521 23rd Ave
- 2211 Parsons Blvd
- 14422 22nd Ave
- 144-22 22nd Ave
- 2228 Parsons Blvd
- 145-23 23rd Ave Unit 1
- 145-23 23rd Ave
- 14523 23rd Ave
- 22-09 Parsons Blvd
- 22-34 Parsons Blvd
- 2234 Parsons Blvd
- 22-34 Parsons Blvd Unit House
- 2234 Parsons Blvd Unit House
- 2209 Parsons Blvd
- 2222 Lee St
Your Personal Tour Guide
Ask me questions while you tour the home.