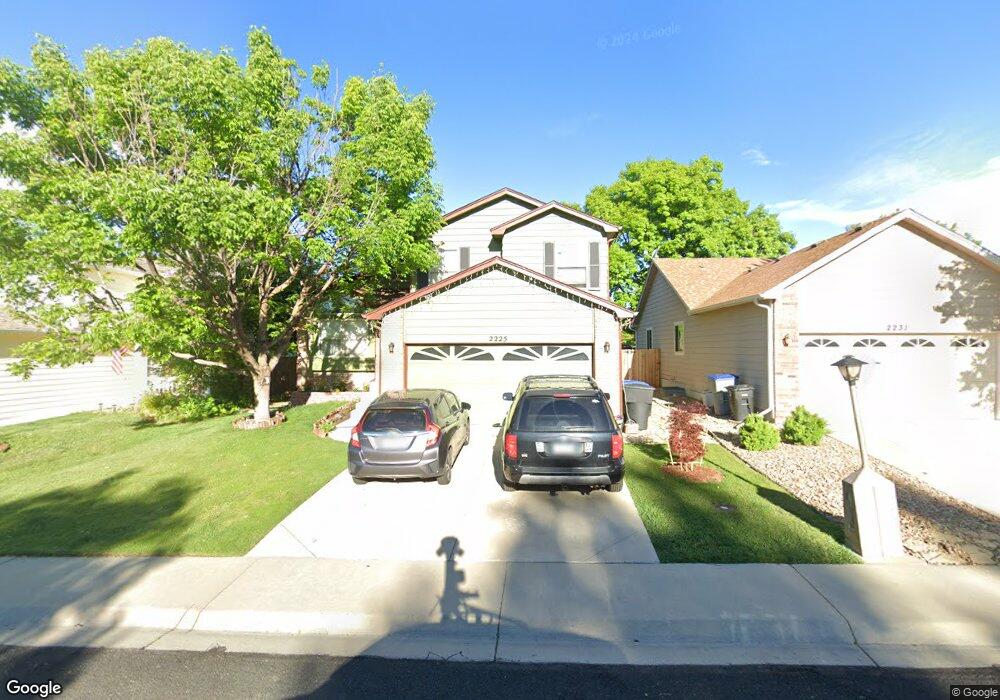
2225 Steele St Longmont, CO 80501
Garden Acres NeighborhoodEstimated Value: $499,000 - $556,000
3
Beds
3
Baths
2,018
Sq Ft
$259/Sq Ft
Est. Value
About This Home
This home is located at 2225 Steele St, Longmont, CO 80501 and is currently estimated at $523,316, approximately $259 per square foot. 2225 Steele St is a home located in Boulder County with nearby schools including Sanborn Elementary School, Longs Peak Middle School, and Longmont High School.
Ownership History
Date
Name
Owned For
Owner Type
Purchase Details
Closed on
Mar 22, 2004
Sold by
Renken Wendell L and Renken Mary F
Bought by
Karki Ramesh and Karki Ashi Pega
Current Estimated Value
Home Financials for this Owner
Home Financials are based on the most recent Mortgage that was taken out on this home.
Original Mortgage
$179,400
Outstanding Balance
$83,667
Interest Rate
5.64%
Mortgage Type
Purchase Money Mortgage
Estimated Equity
$439,649
Purchase Details
Closed on
Mar 29, 1996
Sold by
Progressive Living Structures Inc
Bought by
Renken Wendell L
Home Financials for this Owner
Home Financials are based on the most recent Mortgage that was taken out on this home.
Original Mortgage
$134,000
Interest Rate
6.92%
Mortgage Type
Balloon
Purchase Details
Closed on
Nov 17, 1992
Bought by
Karki Karki Ramesh Ramesh and Karki Ashi Pega
Purchase Details
Closed on
Nov 5, 1984
Bought by
Karki Karki Ramesh Ramesh and Karki Ashi Pega
Create a Home Valuation Report for This Property
The Home Valuation Report is an in-depth analysis detailing your home's value as well as a comparison with similar homes in the area
Home Values in the Area
Average Home Value in this Area
Purchase History
| Date | Buyer | Sale Price | Title Company |
|---|---|---|---|
| Karki Ramesh | $224,250 | Land Title | |
| Renken Wendell L | $149,770 | -- | |
| Karki Karki Ramesh Ramesh | $643,500 | -- | |
| Karki Karki Ramesh Ramesh | -- | -- |
Source: Public Records
Mortgage History
| Date | Status | Borrower | Loan Amount |
|---|---|---|---|
| Open | Karki Ramesh | $179,400 | |
| Previous Owner | Renken Wendell L | $134,000 | |
| Closed | Karki Ramesh | $44,850 |
Source: Public Records
Tax History Compared to Growth
Tax History
| Year | Tax Paid | Tax Assessment Tax Assessment Total Assessment is a certain percentage of the fair market value that is determined by local assessors to be the total taxable value of land and additions on the property. | Land | Improvement |
|---|---|---|---|---|
| 2025 | $2,769 | $29,962 | $5,056 | $24,906 |
| 2024 | $2,769 | $29,962 | $5,056 | $24,906 |
| 2023 | $2,731 | $28,944 | $5,695 | $26,934 |
| 2022 | $2,433 | $24,582 | $4,107 | $20,475 |
| 2021 | $2,464 | $25,290 | $4,226 | $21,064 |
| 2020 | $2,324 | $23,924 | $3,790 | $20,134 |
| 2019 | $2,287 | $23,924 | $3,790 | $20,134 |
| 2018 | $1,991 | $20,959 | $3,456 | $17,503 |
| 2017 | $1,964 | $23,172 | $3,821 | $19,351 |
| 2016 | $1,759 | $18,403 | $4,696 | $13,707 |
| 2015 | $1,676 | $14,718 | $4,378 | $10,340 |
| 2014 | $1,375 | $14,718 | $4,378 | $10,340 |
Source: Public Records
Map
Nearby Homes
- 2158 Rockspray Ct
- 2138 Cypress St
- 2421 Maplewood Cir W
- 2425 Willow Ln
- 2425 Spencer St
- 2634 Westlake Ct
- 2500 Sunset Dr
- 2078 Goldfinch Ct
- 2108 Tulip St
- 12788 Sheramdi St
- 2034 Sumac St
- 12682 Anhawa Ave
- 1851 Trevor Cir
- 2330 Wedgewood Ave
- 2104 18th Ave
- 2292 Spinnaker Cir
- 2508 Danbury Dr
- 2521 Danbury Dr
- 1512 Flemming Dr
- 3119 Lake Park Way