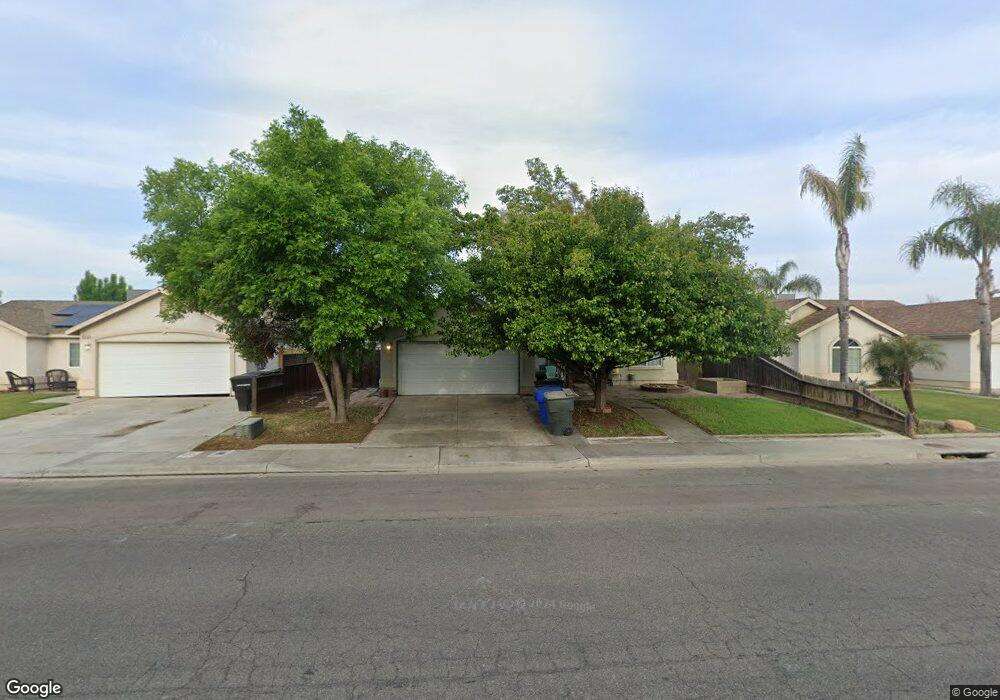
2226 N Glacier Way Hanford, CA 93230
Estimated Value: $324,000 - $362,000
3
Beds
2
Baths
1,232
Sq Ft
$279/Sq Ft
Est. Value
About This Home
This home is located at 2226 N Glacier Way, Hanford, CA 93230 and is currently estimated at $344,259, approximately $279 per square foot. 2226 N Glacier Way is a home located in Kings County with nearby schools including Monroe Elementary School, Woodrow Wilson Junior High School, and Hanford West High School.
Ownership History
Date
Name
Owned For
Owner Type
Purchase Details
Closed on
Jul 26, 2023
Sold by
Hernandez Jessica Fonseca
Bought by
Jessica Fonseca Hernandez 2023 Revocable Livi and Hernandez
Current Estimated Value
Purchase Details
Closed on
Jul 22, 2023
Sold by
Hernandez Jessica Fonseca
Bought by
Jessica Fonseca Hernandez 2023 Revocable Livi and Hernandez
Purchase Details
Closed on
Mar 19, 2022
Sold by
Hernandez Jessica F
Bought by
Hernandez Jessica F
Home Financials for this Owner
Home Financials are based on the most recent Mortgage that was taken out on this home.
Original Mortgage
$100,000
Interest Rate
4.16%
Mortgage Type
New Conventional
Purchase Details
Closed on
Mar 19, 2002
Sold by
Garavello Investments Llc
Bought by
Hernandez Jessica F and Cortez Jennie F
Home Financials for this Owner
Home Financials are based on the most recent Mortgage that was taken out on this home.
Original Mortgage
$43,721
Interest Rate
6.52%
Mortgage Type
FHA
Create a Home Valuation Report for This Property
The Home Valuation Report is an in-depth analysis detailing your home's value as well as a comparison with similar homes in the area
Home Values in the Area
Average Home Value in this Area
Purchase History
| Date | Buyer | Sale Price | Title Company |
|---|---|---|---|
| Jessica Fonseca Hernandez 2023 Revocable Livi | -- | None Listed On Document | |
| Jessica Fonseca Hernandez 2023 Revocable Livi | -- | None Listed On Document | |
| Hernandez Jessica F | $72,500 | New Title Company Name | |
| Hernandez Jessica F | $113,500 | Chicago Title Co |
Source: Public Records
Mortgage History
| Date | Status | Borrower | Loan Amount |
|---|---|---|---|
| Previous Owner | Hernandez Jessica F | $100,000 | |
| Previous Owner | Hernandez Jessica F | $43,721 |
Source: Public Records
Tax History Compared to Growth
Tax History
| Year | Tax Paid | Tax Assessment Tax Assessment Total Assessment is a certain percentage of the fair market value that is determined by local assessors to be the total taxable value of land and additions on the property. | Land | Improvement |
|---|---|---|---|---|
| 2025 | $1,662 | $320,000 | $80,000 | $240,000 |
| 2023 | $1,662 | $157,410 | $41,761 | $115,649 |
| 2022 | $1,625 | $154,325 | $40,943 | $113,382 |
| 2021 | $1,588 | $151,300 | $40,141 | $111,159 |
| 2020 | $1,604 | $149,748 | $39,729 | $110,019 |
| 2019 | $1,576 | $146,812 | $38,950 | $107,862 |
| 2018 | $1,529 | $143,933 | $38,186 | $105,747 |
| 2017 | $1,504 | $141,111 | $37,437 | $103,674 |
| 2016 | $1,483 | $138,344 | $36,703 | $101,641 |
| 2015 | $1,473 | $136,266 | $36,152 | $100,114 |
| 2014 | $1,442 | $133,597 | $35,444 | $98,153 |
Source: Public Records
Map
Nearby Homes
- 1366 Muscat Ct
- 1365 Muscat Ct
- 1374 Semillon St
- 1384 W Bella Oaks Way
- 1411 Bella Oaks Way
- 1093 Raymond Rd
- 1551 N Mitchell St
- 1527 N Mitchell St
- 1528 N Mitchell St
- 1588 N Mitchell St
- 795 Laurence Ln
- 2127 N 11th Ave
- 1128 W Orange St
- 2604 Chianti Way
- 1923 Emma Lee Ln
- 1674 W Castoro Way
- 1674 Castoro Way
- 2035 W Chianti Way
- 496 W Earl Way
- 1967 Mulberry Dr
- 2236 N Glacier Way
- 2216 N Glacier Way Unit II
- 2237 N Heron Dr
- 2229 N Heron Dr
- 2246 N Glacier Way
- 2247 N Heron Dr
- 1222 W Cortner St
- 1189 Yellowstone Dr
- 1238 W Cortner St
- 2254 N Glacier Way
- 1254 W Cortner St
- 1190 Yellowstone Dr
- 2220 N Heron Dr
- 2255 N Heron Dr
- 1276 W Cortner St
- 2262 N Glacier Way
- 1161 Yellowstone Dr
- 1188 W Cortner St
- 1162 W Cortner St
- 1160 Yellowstone Dr