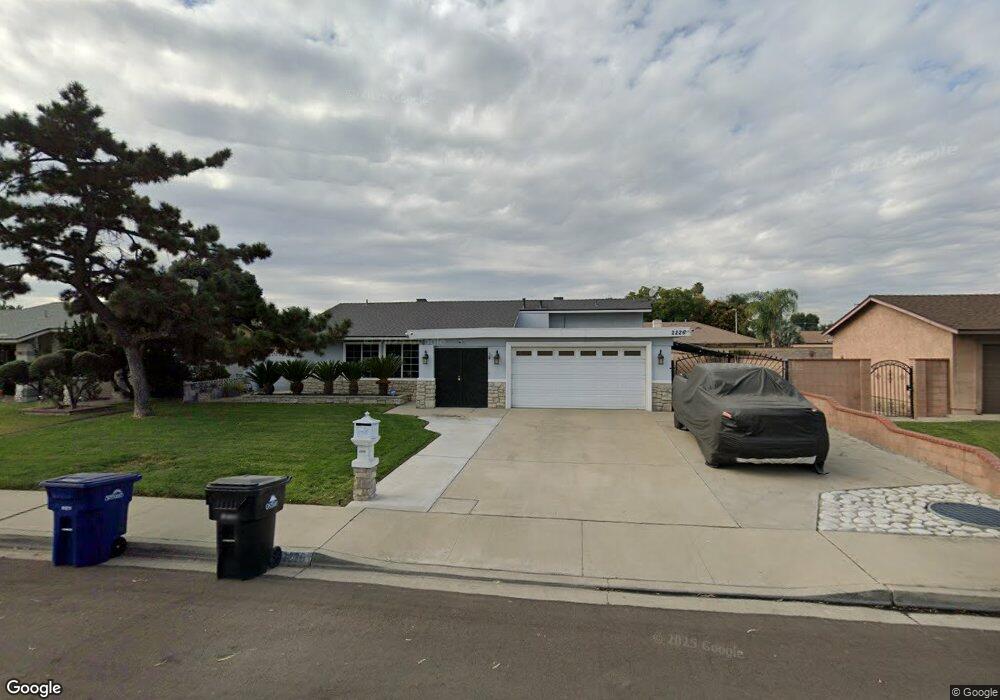
2226 S Fuchsia Ave Ontario, CA 91762
Downtown Ontario NeighborhoodEstimated Value: $726,000 - $794,000
4
Beds
2
Baths
1,423
Sq Ft
$527/Sq Ft
Est. Value
About This Home
This home is located at 2226 S Fuchsia Ave, Ontario, CA 91762 and is currently estimated at $750,407, approximately $527 per square foot. 2226 S Fuchsia Ave is a home located in San Bernardino County with nearby schools including Alicia Cortez Elementary, Magnolia Junior High, and Chino High School.
Ownership History
Date
Name
Owned For
Owner Type
Purchase Details
Closed on
Dec 17, 2013
Sold by
Archibeque Christopher M
Bought by
Archibeque Christopher M and Archibeque Angela P
Current Estimated Value
Home Financials for this Owner
Home Financials are based on the most recent Mortgage that was taken out on this home.
Original Mortgage
$253,800
Outstanding Balance
$190,518
Interest Rate
4.32%
Mortgage Type
New Conventional
Estimated Equity
$559,889
Purchase Details
Closed on
Sep 18, 2003
Sold by
Archibeque Angela
Bought by
Archibeque Christopher M
Home Financials for this Owner
Home Financials are based on the most recent Mortgage that was taken out on this home.
Original Mortgage
$144,000
Interest Rate
6.22%
Mortgage Type
Purchase Money Mortgage
Purchase Details
Closed on
Jul 21, 1998
Sold by
Mole Fred and Mole Margaret
Bought by
Archibeque Christopher M
Home Financials for this Owner
Home Financials are based on the most recent Mortgage that was taken out on this home.
Original Mortgage
$146,473
Interest Rate
6.92%
Mortgage Type
FHA
Create a Home Valuation Report for This Property
The Home Valuation Report is an in-depth analysis detailing your home's value as well as a comparison with similar homes in the area
Home Values in the Area
Average Home Value in this Area
Purchase History
| Date | Buyer | Sale Price | Title Company |
|---|---|---|---|
| Archibeque Christopher M | -- | First American | |
| Archibeque Christopher M | -- | New Century Title Company | |
| Archibeque Christopher M | $149,000 | Chicago Title Co |
Source: Public Records
Mortgage History
| Date | Status | Borrower | Loan Amount |
|---|---|---|---|
| Open | Archibeque Christopher M | $253,800 | |
| Closed | Archibeque Christopher M | $144,000 | |
| Previous Owner | Archibeque Christopher M | $146,473 |
Source: Public Records
Tax History Compared to Growth
Tax History
| Year | Tax Paid | Tax Assessment Tax Assessment Total Assessment is a certain percentage of the fair market value that is determined by local assessors to be the total taxable value of land and additions on the property. | Land | Improvement |
|---|---|---|---|---|
| 2025 | $2,475 | $233,595 | $58,477 | $175,118 |
| 2024 | $2,475 | $229,014 | $57,330 | $171,684 |
| 2023 | $2,405 | $224,524 | $56,206 | $168,318 |
| 2022 | $2,389 | $220,122 | $55,104 | $165,018 |
| 2021 | $2,341 | $215,806 | $54,024 | $161,782 |
| 2020 | $2,311 | $213,593 | $53,470 | $160,123 |
| 2019 | $2,269 | $209,405 | $52,422 | $156,983 |
| 2018 | $2,218 | $205,299 | $51,394 | $153,905 |
| 2017 | $2,177 | $201,273 | $50,386 | $150,887 |
| 2016 | $2,033 | $197,326 | $49,398 | $147,928 |
| 2015 | $1,992 | $194,362 | $48,656 | $145,706 |
| 2014 | $1,951 | $190,555 | $47,703 | $142,852 |
Source: Public Records
Map
Nearby Homes
- 2321 S Magnolia Ave Unit 6E
- 12321 Gardenia Place
- 926 W Philadelphia St Unit 49
- 926 W Philadelphia St Unit R99
- 926 W Philadelphia St Unit 10
- 12351 Twin Gables Dr
- 12524 Ross Ave
- 5610 Guardian Way
- 1726 S Mountain Ave Unit C
- 1712 S Mountain Ave Unit E
- 1706 S Mountain Ave
- 11782 Vernon Ave
- 1604 S Mountain Ave Unit D
- 12638 Verdugo Ave
- 12811 Oaks Ave
- 2022 S San Antonio Ave
- 12796 17th St
- 558 W Philadelphia St
- 5500 Francis Ave
- 6542 Hamilton St
- 2218 S Fuchsia Ave
- 2234 S Fuchsia Ave
- 2227 S Gardenia Ave
- 2210 S Fuchsia Ave
- 2240 S Fuchsia Ave
- 2243 S Gardenia Ave
- 2227 S Fuchsia Ave
- 2219 S Fuchsia Ave
- 2235 S Fuchsia Ave
- 2211 S Gardenia Ave
- 2211 S Fuchsia Ave
- 2204 S Fuchsia Ave
- 2241 S Fuchsia Ave
- 2226 S Elderberry Ave
- 2218 S Elderberry Ave
- 2205 S Fuchsia Ave
- 2234 S Elderberry Ave
- 2210 S Elderberry Ave
- 2240 S Elderberry Ave
- 1261 W Monticello St