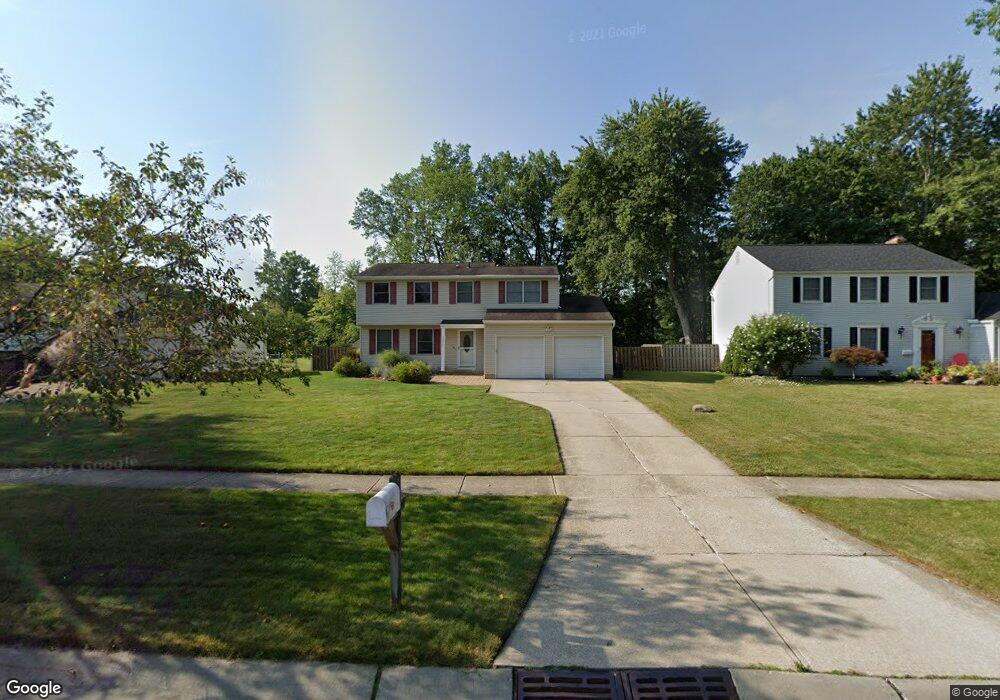
22275 Jonathan Dr Strongsville, OH 44149
Estimated Value: $292,000 - $333,000
4
Beds
2
Baths
1,685
Sq Ft
$185/Sq Ft
Est. Value
About This Home
This home is located at 22275 Jonathan Dr, Strongsville, OH 44149 and is currently estimated at $312,236, approximately $185 per square foot. 22275 Jonathan Dr is a home located in Cuyahoga County with nearby schools including Strongsville High School, St Mary School, and Sts Joseph & John Interparochial School.
Ownership History
Date
Name
Owned For
Owner Type
Purchase Details
Closed on
Oct 7, 1997
Sold by
Carlson Mary F
Bought by
Schneider James H and Schneider Debra A
Current Estimated Value
Home Financials for this Owner
Home Financials are based on the most recent Mortgage that was taken out on this home.
Original Mortgage
$108,000
Outstanding Balance
$17,489
Interest Rate
7.54%
Mortgage Type
New Conventional
Estimated Equity
$294,748
Purchase Details
Closed on
Dec 31, 1990
Sold by
Kocka David C
Bought by
Carlson Daniel L
Purchase Details
Closed on
Mar 24, 1987
Sold by
Detullio Priscilla L
Bought by
Kocka David C
Purchase Details
Closed on
Oct 1, 1980
Sold by
Priscilla L De Tullio
Bought by
Detullio Priscilla L
Purchase Details
Closed on
Aug 21, 1980
Sold by
Detullio Phillip I
Bought by
Priscilla L De Tullio
Purchase Details
Closed on
Mar 16, 1977
Sold by
Bacon David R and Bacon Judy A
Bought by
Detullio Phillip I
Purchase Details
Closed on
Jan 1, 1975
Bought by
Bacon David R and Bacon Judy A
Create a Home Valuation Report for This Property
The Home Valuation Report is an in-depth analysis detailing your home's value as well as a comparison with similar homes in the area
Home Values in the Area
Average Home Value in this Area
Purchase History
| Date | Buyer | Sale Price | Title Company |
|---|---|---|---|
| Schneider James H | $138,000 | -- | |
| Carlson Daniel L | $108,000 | -- | |
| Kocka David C | $85,000 | -- | |
| Detullio Priscilla L | -- | -- | |
| Priscilla L De Tullio | -- | -- | |
| Detullio Phillip I | $55,000 | -- | |
| Bacon David R | -- | -- |
Source: Public Records
Mortgage History
| Date | Status | Borrower | Loan Amount |
|---|---|---|---|
| Open | Schneider James H | $108,000 |
Source: Public Records
Tax History Compared to Growth
Tax History
| Year | Tax Paid | Tax Assessment Tax Assessment Total Assessment is a certain percentage of the fair market value that is determined by local assessors to be the total taxable value of land and additions on the property. | Land | Improvement |
|---|---|---|---|---|
| 2024 | $4,000 | $85,190 | $17,150 | $68,040 |
| 2023 | $4,359 | $69,620 | $16,100 | $53,520 |
| 2022 | $4,328 | $69,615 | $16,100 | $53,515 |
| 2021 | $4,293 | $69,620 | $16,100 | $53,520 |
| 2020 | $3,978 | $57,050 | $13,200 | $43,860 |
| 2019 | $3,861 | $163,000 | $37,700 | $125,300 |
| 2018 | $3,534 | $57,050 | $13,200 | $43,860 |
| 2017 | $3,629 | $53,340 | $10,990 | $42,350 |
| 2016 | $3,600 | $53,340 | $10,990 | $42,350 |
| 2015 | $3,548 | $53,340 | $10,990 | $42,350 |
| 2014 | $3,548 | $51,810 | $10,680 | $41,130 |
Source: Public Records
Map
Nearby Homes
- 8746 Barton Dr
- 8902 Lincolnshire Blvd
- 9598 Pebble Brook Ln
- 9384 N Marks Rd
- 9829 Plum Brook Ln
- 22300 Rock Creek Cir
- 10001 N Marks Rd
- 8627 Courtland Dr
- 0 Priem Rd
- 8036 Fair Rd
- 458 Sprague Rd
- 8896 Firethorne Dr
- 10800 Meadow Trail
- 8981 Leatherleaf Dr
- 10353 Oak Branch Trail
- 8809 Leatherleaf Dr
- 10824 Watercress Rd
- 8960 Leatherleaf Dr
- 8839 Leatherleaf Dr
- 10842 Fence Row Dr
- 22279 Jonathan Dr
- 22269 Jonathan Dr
- 22285 Jonathan Dr
- 22265 Jonathan Dr
- 22291 Jonathan Dr
- 22261 Jonathan Dr
- 22274 Jonathan Dr
- 22268 Jonathan Dr
- 22262 Jonathan Dr
- 22280 Jonathan Dr
- 8601 Barton Dr
- 22295 Jonathan Dr
- 22255 Jonathan Dr
- 22288 Jonathan Dr
- 8673 Barton Dr
- 22258 Jonathan Dr
- 8454 Bernice Dr
- 22249 Jonathan Dr
- 22292 Jonathan Dr
- 8449 Bernice Dr