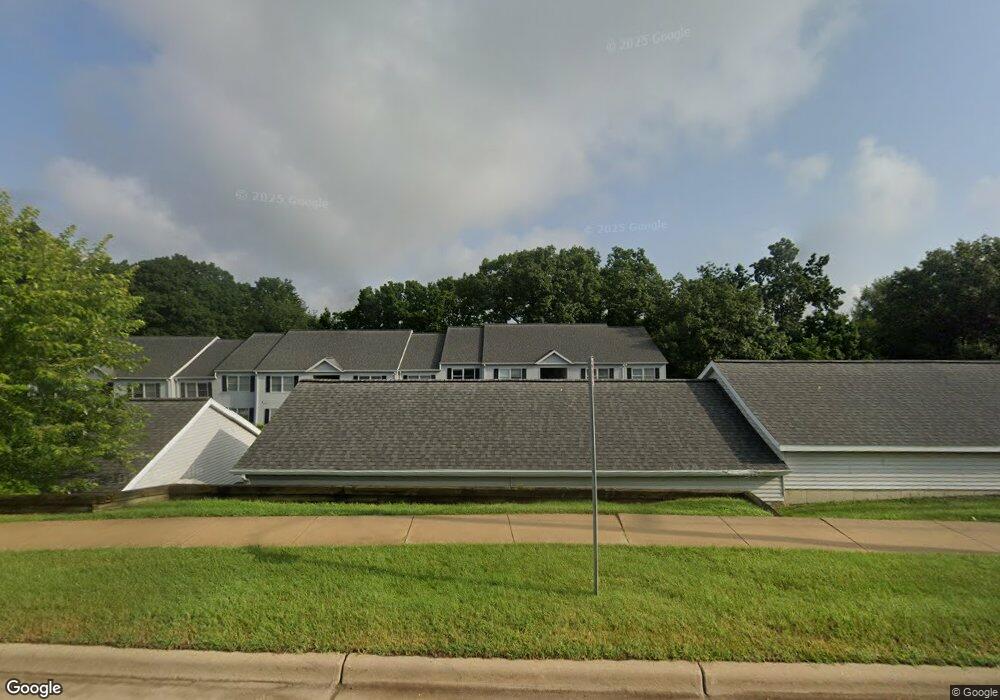
2228 Parkview Ave Unit 4 Kalamazoo, MI 49008
Oakland-Winchell NeighborhoodEstimated Value: $214,000 - $239,000
2
Beds
2
Baths
1,450
Sq Ft
$156/Sq Ft
Est. Value
About This Home
This home is located at 2228 Parkview Ave Unit 4, Kalamazoo, MI 49008 and is currently estimated at $226,711, approximately $156 per square foot. 2228 Parkview Ave Unit 4 is a home located in Kalamazoo County with nearby schools including Winchell Elementary School, Maple Street Magnet School for the Arts, and Loy Norrix High School.
Ownership History
Date
Name
Owned For
Owner Type
Purchase Details
Closed on
Jul 8, 2020
Sold by
Wdowicki Julie A and Ludvig Mccartney Patti
Bought by
Sandin Linda A
Current Estimated Value
Home Financials for this Owner
Home Financials are based on the most recent Mortgage that was taken out on this home.
Original Mortgage
$50,000
Outstanding Balance
$44,254
Interest Rate
3%
Mortgage Type
New Conventional
Estimated Equity
$182,457
Purchase Details
Closed on
Aug 15, 2018
Sold by
Mccartney Frances H and Godsey Richard G
Bought by
Mccartney Frances H and Wdowicki Julie A
Purchase Details
Closed on
Jun 15, 2004
Sold by
Antosz Barbara A
Bought by
Godsey Richard S and Mccartney Frances H
Home Financials for this Owner
Home Financials are based on the most recent Mortgage that was taken out on this home.
Original Mortgage
$109,600
Interest Rate
5.37%
Mortgage Type
Purchase Money Mortgage
Create a Home Valuation Report for This Property
The Home Valuation Report is an in-depth analysis detailing your home's value as well as a comparison with similar homes in the area
Home Values in the Area
Average Home Value in this Area
Purchase History
| Date | Buyer | Sale Price | Title Company |
|---|---|---|---|
| Sandin Linda A | $100,000 | Devon Title Company | |
| Mccartney Frances H | -- | None Available | |
| Godsey Richard S | $137,000 | Chicago Title |
Source: Public Records
Mortgage History
| Date | Status | Borrower | Loan Amount |
|---|---|---|---|
| Open | Sandin Linda A | $50,000 | |
| Previous Owner | Godsey Richard S | $109,600 |
Source: Public Records
Tax History Compared to Growth
Tax History
| Year | Tax Paid | Tax Assessment Tax Assessment Total Assessment is a certain percentage of the fair market value that is determined by local assessors to be the total taxable value of land and additions on the property. | Land | Improvement |
|---|---|---|---|---|
| 2025 | $4,352 | $119,900 | $0 | $0 |
| 2024 | $2,430 | $107,300 | $0 | $0 |
| 2023 | $2,316 | $94,500 | $0 | $0 |
| 2022 | $3,947 | $83,000 | $0 | $0 |
| 2021 | $3,816 | $74,400 | $0 | $0 |
| 2020 | $2,393 | $70,800 | $0 | $0 |
| 2019 | $2,282 | $54,900 | $0 | $0 |
| 2018 | $2,228 | $62,000 | $0 | $0 |
| 2017 | $2,287 | $63,100 | $0 | $0 |
| 2016 | $2,287 | $45,100 | $0 | $0 |
| 2015 | $2,287 | $45,000 | $0 | $0 |
| 2014 | $2,287 | $42,900 | $0 | $0 |
Source: Public Records
Map
Nearby Homes
- 2306 Benton Ave
- 2525 Sheffield Dr
- 1907 Chevy Chase Blvd
- 2616 Lomond Dr
- 1761 Chevy Chase Blvd
- 3316 Lowden St
- 2208 Winchell Ave
- 2433 Oakland Dr
- 2520 Stevens Ave
- 2920 Amherst Ave
- 3924 Oakland Dr
- 2418 Edgewood Dr
- 1734 Embury Rd
- 2146 Treehaven Dr
- 2702 Mockingbird Dr
- 3237 Old Colony Rd
- 4240 Oakland Dr
- 1122 Parker Ave
- 1028 Clover St
- 1936 W Kilgore Rd
- 2226 Parkview Ave Unit 2
- 2230 Parkview Ave
- 2232 Parkview Ave Unit 1
- 2224 Parkview Ave Unit 11
- 2222 Parkview Ave Unit 9
- 2234 Parkview Ave
- 2220 Parkview Ave Unit 7
- 2236 Parkview Ave Unit 5
- 2218 Parkview Ave
- 2216 Parkview Ave Unit 10
- 2216 Parkview Ave Unit D-2
- 2236 Crest Dr
- 2214 Parkview Ave Unit 8
- 2212 Parkview Ave Unit 17
- 2210 Parkview Ave
- 2206 Parkview Ave Unit 18
- 2204 Parkview Ave
- 2202 Parkview Ave Unit 14
- 2200 Parkview Ave
- 2122 Parkview Ave