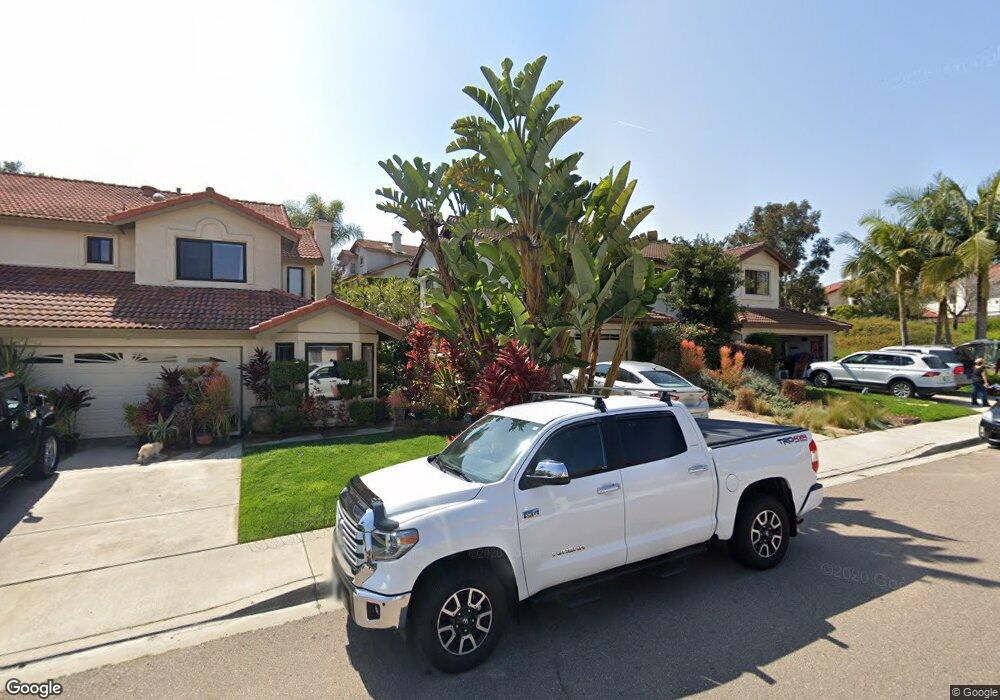
2228 Summerhill Dr Encinitas, CA 92024
Central Encinitas NeighborhoodEstimated Value: $1,321,297 - $1,561,000
3
Beds
3
Baths
1,745
Sq Ft
$821/Sq Ft
Est. Value
About This Home
This home is located at 2228 Summerhill Dr, Encinitas, CA 92024 and is currently estimated at $1,433,074, approximately $821 per square foot. 2228 Summerhill Dr is a home located in San Diego County with nearby schools including Flora Vista Elementary, Diegueno Middle School, and La Costa Canyon High School.
Ownership History
Date
Name
Owned For
Owner Type
Purchase Details
Closed on
Jul 8, 2020
Sold by
Schrad Joleen M and Abrams Rush
Bought by
Schrad Joleen M and Abrams Rush
Current Estimated Value
Home Financials for this Owner
Home Financials are based on the most recent Mortgage that was taken out on this home.
Original Mortgage
$175,000
Outstanding Balance
$123,641
Interest Rate
3.1%
Mortgage Type
New Conventional
Estimated Equity
$1,309,433
Purchase Details
Closed on
Aug 5, 2011
Sold by
Waldorf James W and Fletcher Cheryl M
Bought by
Schrad Joleen M and Abrams Rush
Home Financials for this Owner
Home Financials are based on the most recent Mortgage that was taken out on this home.
Original Mortgage
$470,200
Outstanding Balance
$323,428
Interest Rate
4.43%
Mortgage Type
FHA
Estimated Equity
$1,109,646
Purchase Details
Closed on
Dec 27, 2001
Sold by
Waldorf Elaine M
Bought by
Waldorf Elaine M
Purchase Details
Closed on
Jul 15, 1985
Create a Home Valuation Report for This Property
The Home Valuation Report is an in-depth analysis detailing your home's value as well as a comparison with similar homes in the area
Home Values in the Area
Average Home Value in this Area
Purchase History
| Date | Buyer | Sale Price | Title Company |
|---|---|---|---|
| Schrad Joleen M | -- | First American Title Company | |
| Schrad Joleen M | $495,000 | First American Title San Die | |
| Waldorf Elaine M | -- | -- | |
| -- | $116,000 | -- |
Source: Public Records
Mortgage History
| Date | Status | Borrower | Loan Amount |
|---|---|---|---|
| Open | Schrad Joleen M | $175,000 | |
| Open | Schrad Joleen M | $470,200 |
Source: Public Records
Tax History
| Year | Tax Paid | Tax Assessment Tax Assessment Total Assessment is a certain percentage of the fair market value that is determined by local assessors to be the total taxable value of land and additions on the property. | Land | Improvement |
|---|---|---|---|---|
| 2025 | $7,089 | $621,733 | $433,332 | $188,401 |
| 2024 | $7,089 | $609,543 | $424,836 | $184,707 |
| 2023 | $6,880 | $597,592 | $416,506 | $181,086 |
| 2022 | $6,711 | $585,876 | $408,340 | $177,536 |
| 2021 | $6,594 | $574,389 | $400,334 | $174,055 |
| 2020 | $6,409 | $568,501 | $396,230 | $172,271 |
| 2019 | $6,282 | $557,355 | $388,461 | $168,894 |
| 2018 | $6,177 | $546,428 | $380,845 | $165,583 |
| 2017 | $191 | $535,715 | $373,378 | $162,337 |
| 2016 | $5,885 | $525,211 | $366,057 | $159,154 |
| 2015 | $5,776 | $517,323 | $360,559 | $156,764 |
| 2014 | $5,638 | $507,191 | $353,497 | $153,694 |
Source: Public Records
Map
Nearby Homes
- 1990 Avenida la Posta
- 1842 Avenida Mimosa
- 1825 Hummock Ln
- 824 Glen Arbor Dr
- 1776 Avenida la Posta
- 1986 Azure Way Unit 107
- 2037 Countrywood Way
- 1971 Azure Way
- 1105 Catania Ct Unit 201
- 804 & 814 Clark Ave
- 3736 38 Via Rancho Michelle
- 200 202 Neptune Ave
- 772 Conestoga Ct
- 250 258 Hillcrest Dr
- 3224 Avenida la Cima
- 1402 Village View Rd
- 905 Olive Crest Dr
- 324 Countrywood Ln
- 1733 Gentle Breeze Ln
- 1830 Gatepost Rd
- 2230 Summerhill Dr
- 2224 Summerhill Dr
- 2222 Summerhill Dr
- 2218 Summerhill Dr
- 1822 Willowspring Dr N
- 2223 Summerhill Dr
- 1826 Willowspring Dr N
- 2227 Summerhill Dr
- 2221 Summerhill Dr
- 2229 Summerhill Dr
- 1820 Willowspring Dr N
- 703 Summersong Ln
- 1828 Willowspring Dr N
- 2217 Summerhill Dr
- 2233 Summerhill Dr
- 705 Summersong Ln
- 1816 Willowspring Dr N
- 1832 Willowspring Dr N
- 2212 Summerhill Dr
- 2215 Summerhill Dr
Your Personal Tour Guide
Ask me questions while you tour the home.