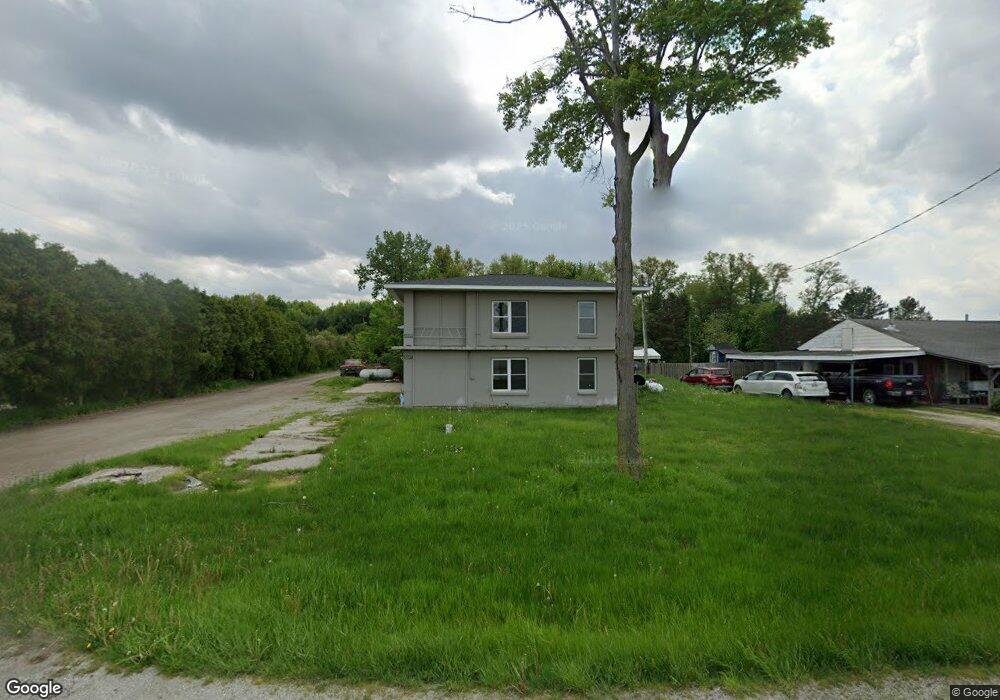
22280 W Us Rte 6 Grand Rapids, OH 43522
Estimated Value: $75,000 - $116,000
4
Beds
2
Baths
1,830
Sq Ft
$54/Sq Ft
Est. Value
About This Home
This home is located at 22280 W Us Rte 6, Grand Rapids, OH 43522 and is currently estimated at $99,474, approximately $54 per square foot. 22280 W Us Rte 6 is a home located in Wood County with nearby schools including Otsego Elementary School, Otsego Junior High School, and Otsego High School.
Ownership History
Date
Name
Owned For
Owner Type
Purchase Details
Closed on
Feb 1, 2021
Sold by
Nwoh Apartments Llc
Bought by
Jacob Willson
Current Estimated Value
Home Financials for this Owner
Home Financials are based on the most recent Mortgage that was taken out on this home.
Original Mortgage
$60,000
Outstanding Balance
$53,617
Interest Rate
2.65%
Mortgage Type
Future Advance Clause Open End Mortgage
Estimated Equity
$45,857
Purchase Details
Closed on
Mar 9, 2015
Sold by
Valleywood Investors and Newlove Lydia J
Bought by
Ne Apartment Llc
Home Financials for this Owner
Home Financials are based on the most recent Mortgage that was taken out on this home.
Original Mortgage
$36,000
Interest Rate
3.56%
Mortgage Type
Future Advance Clause Open End Mortgage
Purchase Details
Closed on
Apr 27, 1994
Sold by
Kelley Timothy P
Bought by
Valleywood Investors
Purchase Details
Closed on
Aug 6, 1976
Bought by
Kelley Richard P
Create a Home Valuation Report for This Property
The Home Valuation Report is an in-depth analysis detailing your home's value as well as a comparison with similar homes in the area
Home Values in the Area
Average Home Value in this Area
Purchase History
| Date | Buyer | Sale Price | Title Company |
|---|---|---|---|
| Jacob Willson | $80,000 | None Available | |
| Ne Apartment Llc | $40,000 | None Available | |
| Valleywood Investors | $75,000 | -- | |
| Kelley Richard P | $23,900 | -- |
Source: Public Records
Mortgage History
| Date | Status | Borrower | Loan Amount |
|---|---|---|---|
| Open | Jacob Willson | $60,000 | |
| Previous Owner | Ne Apartment Llc | $36,000 |
Source: Public Records
Tax History Compared to Growth
Tax History
| Year | Tax Paid | Tax Assessment Tax Assessment Total Assessment is a certain percentage of the fair market value that is determined by local assessors to be the total taxable value of land and additions on the property. | Land | Improvement |
|---|---|---|---|---|
| 2024 | $1,281 | $31,045 | $5,390 | $25,655 |
| 2023 | $1,281 | $31,050 | $5,390 | $25,660 |
| 2022 | $1,187 | $25,970 | $4,480 | $21,490 |
| 2021 | $1,170 | $25,970 | $4,480 | $21,490 |
| 2020 | $1,177 | $25,970 | $4,480 | $21,490 |
| 2019 | $1,079 | $23,030 | $4,480 | $18,550 |
| 2018 | $1,047 | $23,030 | $4,480 | $18,550 |
| 2017 | $1,015 | $23,030 | $4,480 | $18,550 |
| 2016 | $961 | $22,190 | $4,200 | $17,990 |
| 2015 | $961 | $22,190 | $4,200 | $17,990 |
| 2014 | $1,002 | $22,190 | $4,200 | $17,990 |
| 2013 | $1,096 | $22,190 | $4,200 | $17,990 |
Source: Public Records
Map
Nearby Homes
- 22327 U S 6
- 22888 Wintergreen Rd
- 20553 Euler Rd
- 13460 Ash St
- 0 Otsego Pike Unit 6136991
- 20750 Sycamore St
- 20391 Brown Ln
- 20210 Oak St
- 20310 Taylor St
- 23580 4th St
- 19393 U S 6
- 23763 Front St
- 23912 E 2nd St
- 24432 W 3rd St
- 15722 Range Line Rd
- 0 Manore Lot A Rd Unit 6130402
- 0 Manore Lot B Rd Unit 6130403
- 19330 Tuller Rd
- 12200 S River Rd
- 0 Kellogg Rd Unit 6125521
- 22280 Us Highway 6
- 22280 W U S Route 6
- 22277 U S 6
- 22339 Us Highway 6
- 22359 U S 6
- 22359 Us Highway 6
- 0 W Us Rte 6 W
- 22291 Us Highway 6
- 22327 Us Highway 6
- 22277 Us Highway 6
- 22487 Us Highway 6
- 22277 Us Highway 6
- 22373 Us Highway 6
- 22373 Us Highway 6
- 22487 Us Highway 6
- 22155 Us Highway 6
- 22038 Bowling Green Rd W
- 0 US Hwy 6
- 22684 Us Highway 6
- 22684 Bowling Green Rd W